Engineering Economics
Syllabus
Questions
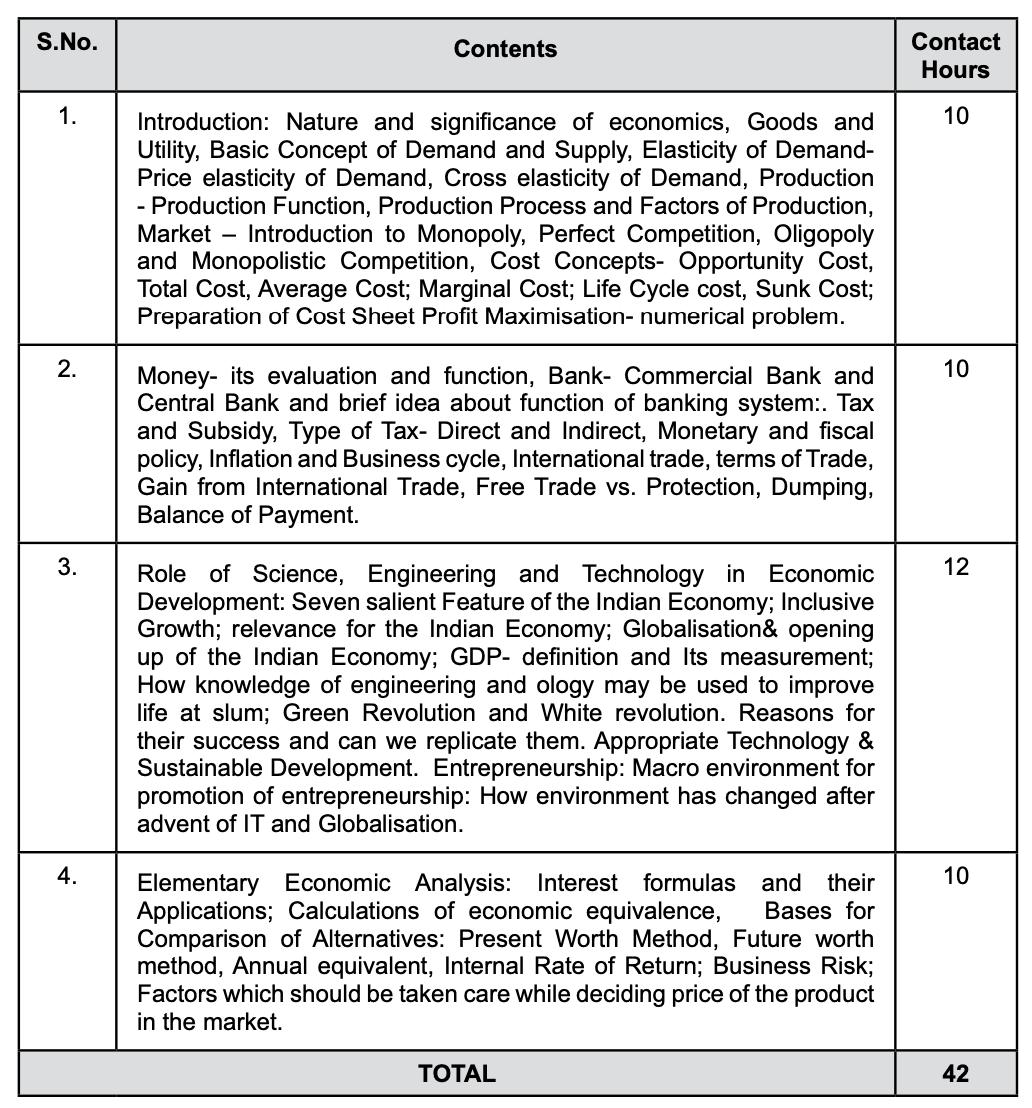
1. Engineering Economics and Its Role in Economic Development
Engineering Economics is the application of economic principles to engineering projects. It involves analyzing costs, benefits, risks, and the efficiency of projects to make informed decisions. It focuses on optimizing resources to ensure that projects are financially viable and sustainable.
- Key Areas in Development:
- Cost-Benefit Analysis: Evaluating whether a project is worth pursuing based on potential returns.
- Investment Decision-Making: Deciding which projects or technologies to invest in for the best economic outcome.
- Optimization of Resources: Ensuring efficient use of limited resources like materials, labor, and capital.
- Infrastructure Development: Supporting the development of national infrastructure (roads, bridges, energy) that contributes to economic growth.
- Technology and Innovation: Engineering economics helps in assessing the financial feasibility of new technologies, encouraging innovation.
Engineering economics plays a key role in making projects more efficient, reducing costs, and improving overall productivity, which contributes to economic growth.
2. Demand and Supply & Factors Affecting Them
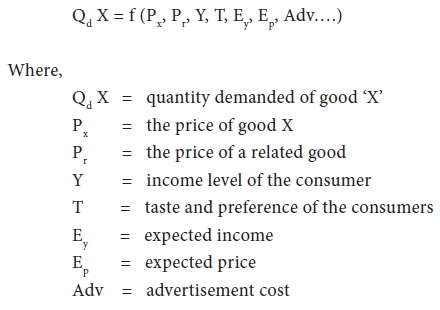
Demand: Demand refers to the quantity of a good or service that consumers are willing and able to buy at different price levels in a given period.
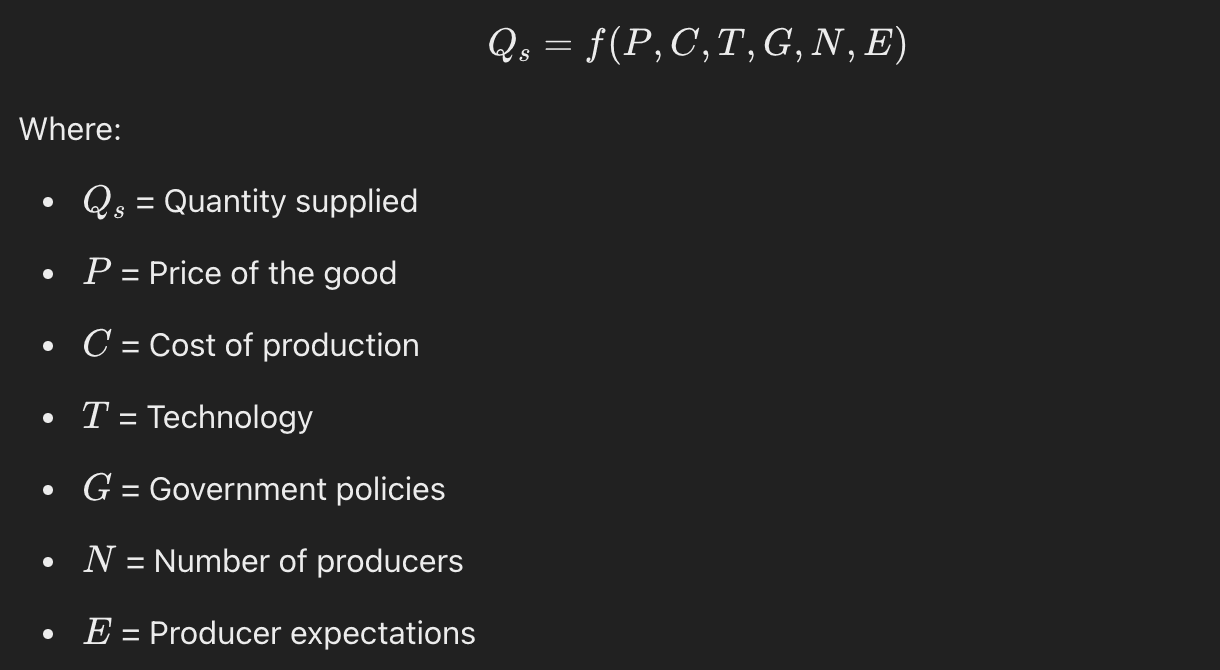
Supply: Supply refers to the quantity of a good or service that producers are willing and able to offer for sale at different price levels.
Factors Affecting Demand:
- Price of the Good: Higher prices usually lead to lower demand, and vice versa (Law of Demand).
- Income Levels: As consumer income increases, the demand for normal goods typically increases, while demand for inferior goods may decrease.
- Tastes and Preferences: Changes in consumer preferences can increase or decrease demand for certain products.
- Price of Related Goods:
- Substitute Goods: An increase in the price of a substitute (e.g., tea for coffee) can increase demand for the other good.
- Complementary Goods: An increase in the price of complementary goods (e.g., cars and fuel) can reduce demand.
- Population: An increase in population generally raises demand for goods and services.
- Future Expectations: If consumers expect prices to rise in the future, they may demand more now.
- Government Policies: Taxes, subsidies, and regulations can influence demand. For example, subsidies can increase demand by lowering prices.
- Seasonality: Certain goods may experience higher demand during specific times of the year, such as winter clothing in colder months.
Factors Affecting Supply:
- Price of the Good: Higher prices lead to higher supply as producers seek greater profits.
- Production Costs: Increased costs of inputs (labor, raw materials) reduce supply, while lower costs increase it.
- Technology: Technological advancements improve production efficiency, increasing supply.
- Government Policies:
- Taxes increase production costs, reducing supply.
- Subsidies lower costs, boosting supply.
- Prices of Related Goods: If a substitute good’s price rises, producers may switch to that good, reducing supply of the original.
- Producer Expectations: If higher future prices are expected, current supply might decrease.
- Natural Conditions: Adverse conditions (e.g., droughts) decrease supply, while favorable conditions increase it.
Introduction
- Scarcity / Economic Goods: When Supply < Demands
- Free Goods : Supply > Demands
Choice to distribute limited resources on unlimited wants is economics.
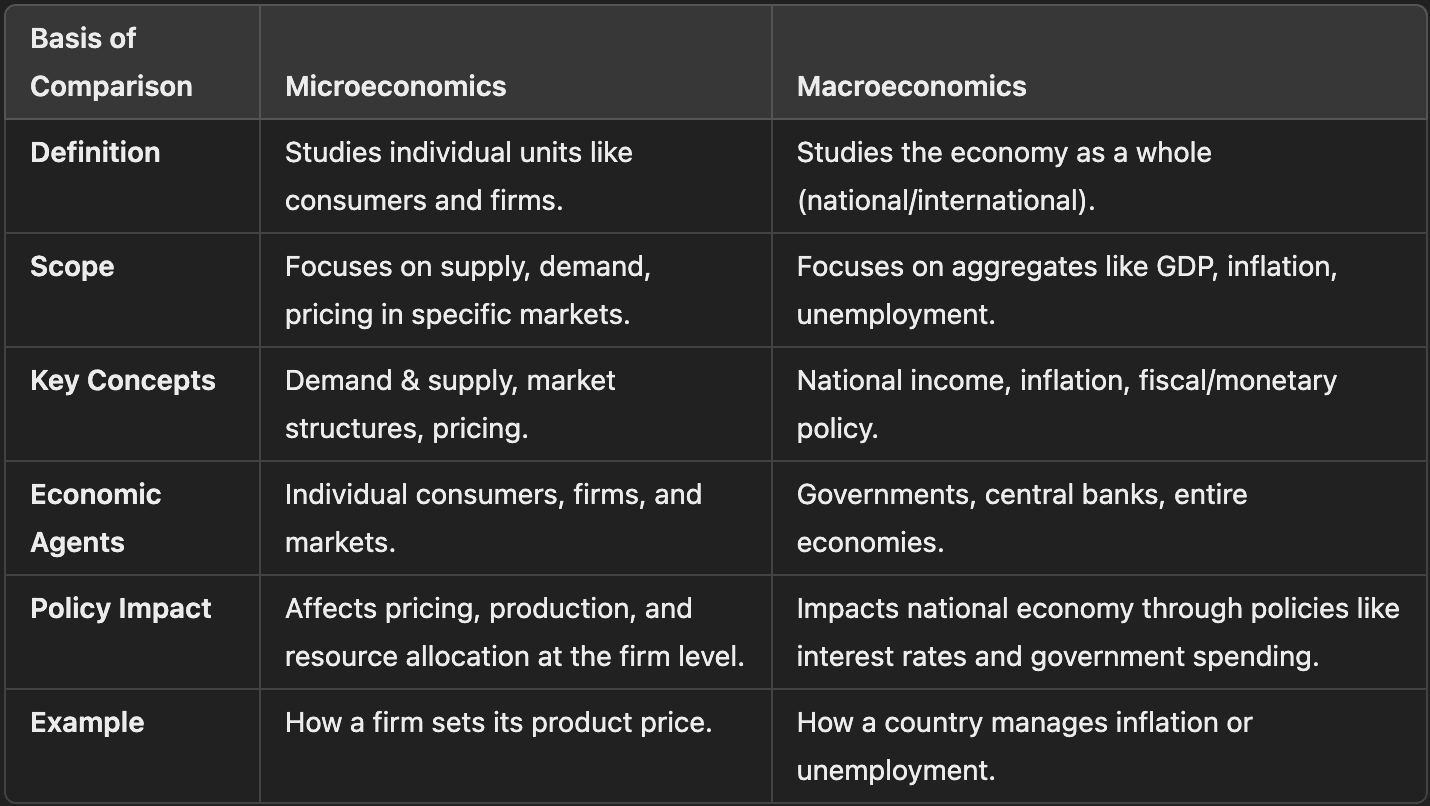
Microeconomics
When problem of choice (economical problem) are at level of individual. At house-hold level.
- Demand theory
- Production theory
- Price determination and factor pricing (distribution)
Macro variables constant
- Market forces (Demand and supply) play a huge role
Macroeconomics
When problem of choice (economical problem) are at level of country as a whole.
- National Income
- GDP
- Total employment
- Inflation
- Population
- Aggregate demand of all goods
Micro variables constant
- Government policies plays a huge role
Economy
Is a system/process by which goods and services are produced, sold & brought in a country/region by which people of an area earn their living.
Simple Economy: degree of interdependence and exchange is of moderate degree.
- Like the good ol' times
- Low income Complex Economy: degree of interdependence and exchange is of high degree.
- Like today
- High income
Types of Economies:
Controlled / Centrally planned economy: High control. Russia, China Free / Market Economy: V. Low control. UK, US Mix Economy: Moderate control. India
Main Economical Problems
- What to produce? War time goods / peace time goods. Customer/capital goods
- How to produce? Labour / Capital Intensive Technique.
- For whom to produce? Poor / Rich
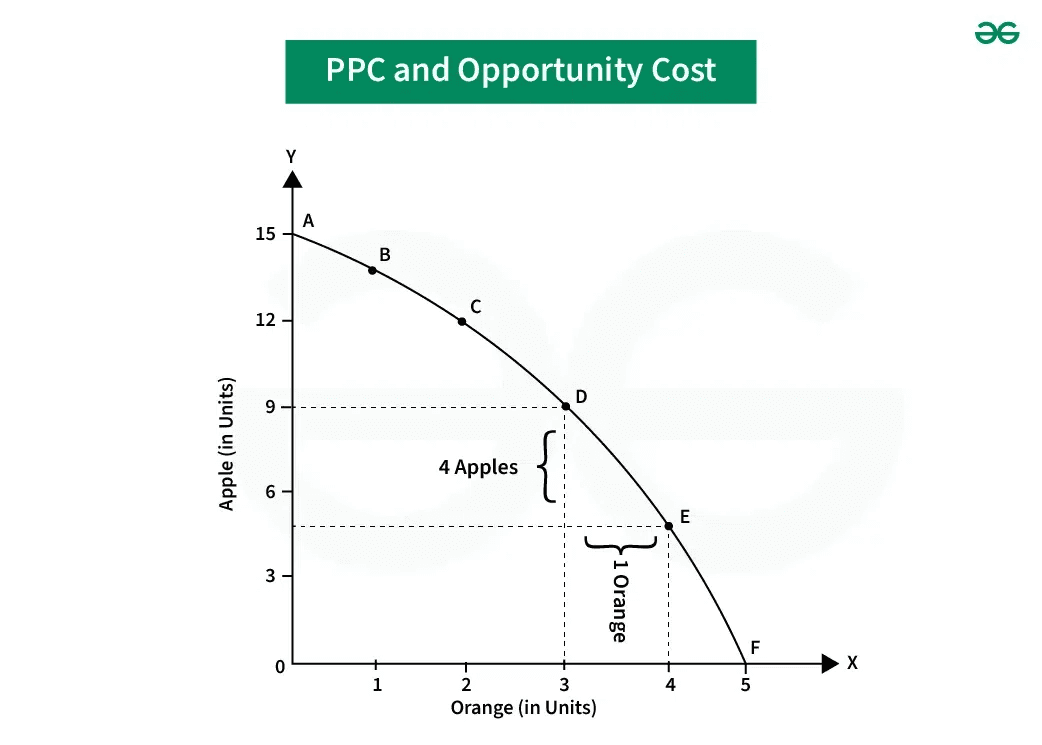
Production Possibility Curve
Is curve showing different combination of two goods which can be produced with available resources on assumption that
- Resources are given
- Given resources are fully and efficiently utilised
- Technology/technique remain constant
- Also known as production boundary/frontier. transformation curve.
- All points on or inside PPC line are attainable. And outside are unattainable.
Shifting / Rotate of PPC
- Change of resources. Increase/decrease -> shift
- Change in technology. -> rotate
Properties
- PPC slopes downwards
- Concave to the point of origin
Opportunity cost
Is the value of the next best alternative, when a decision is made.
Marginal Opportunity Cost
Rate of loss of output of B for every additional unit of A produced when resources are shifted from B to A.
MOC = (loss of output Y) / (gain of output X)
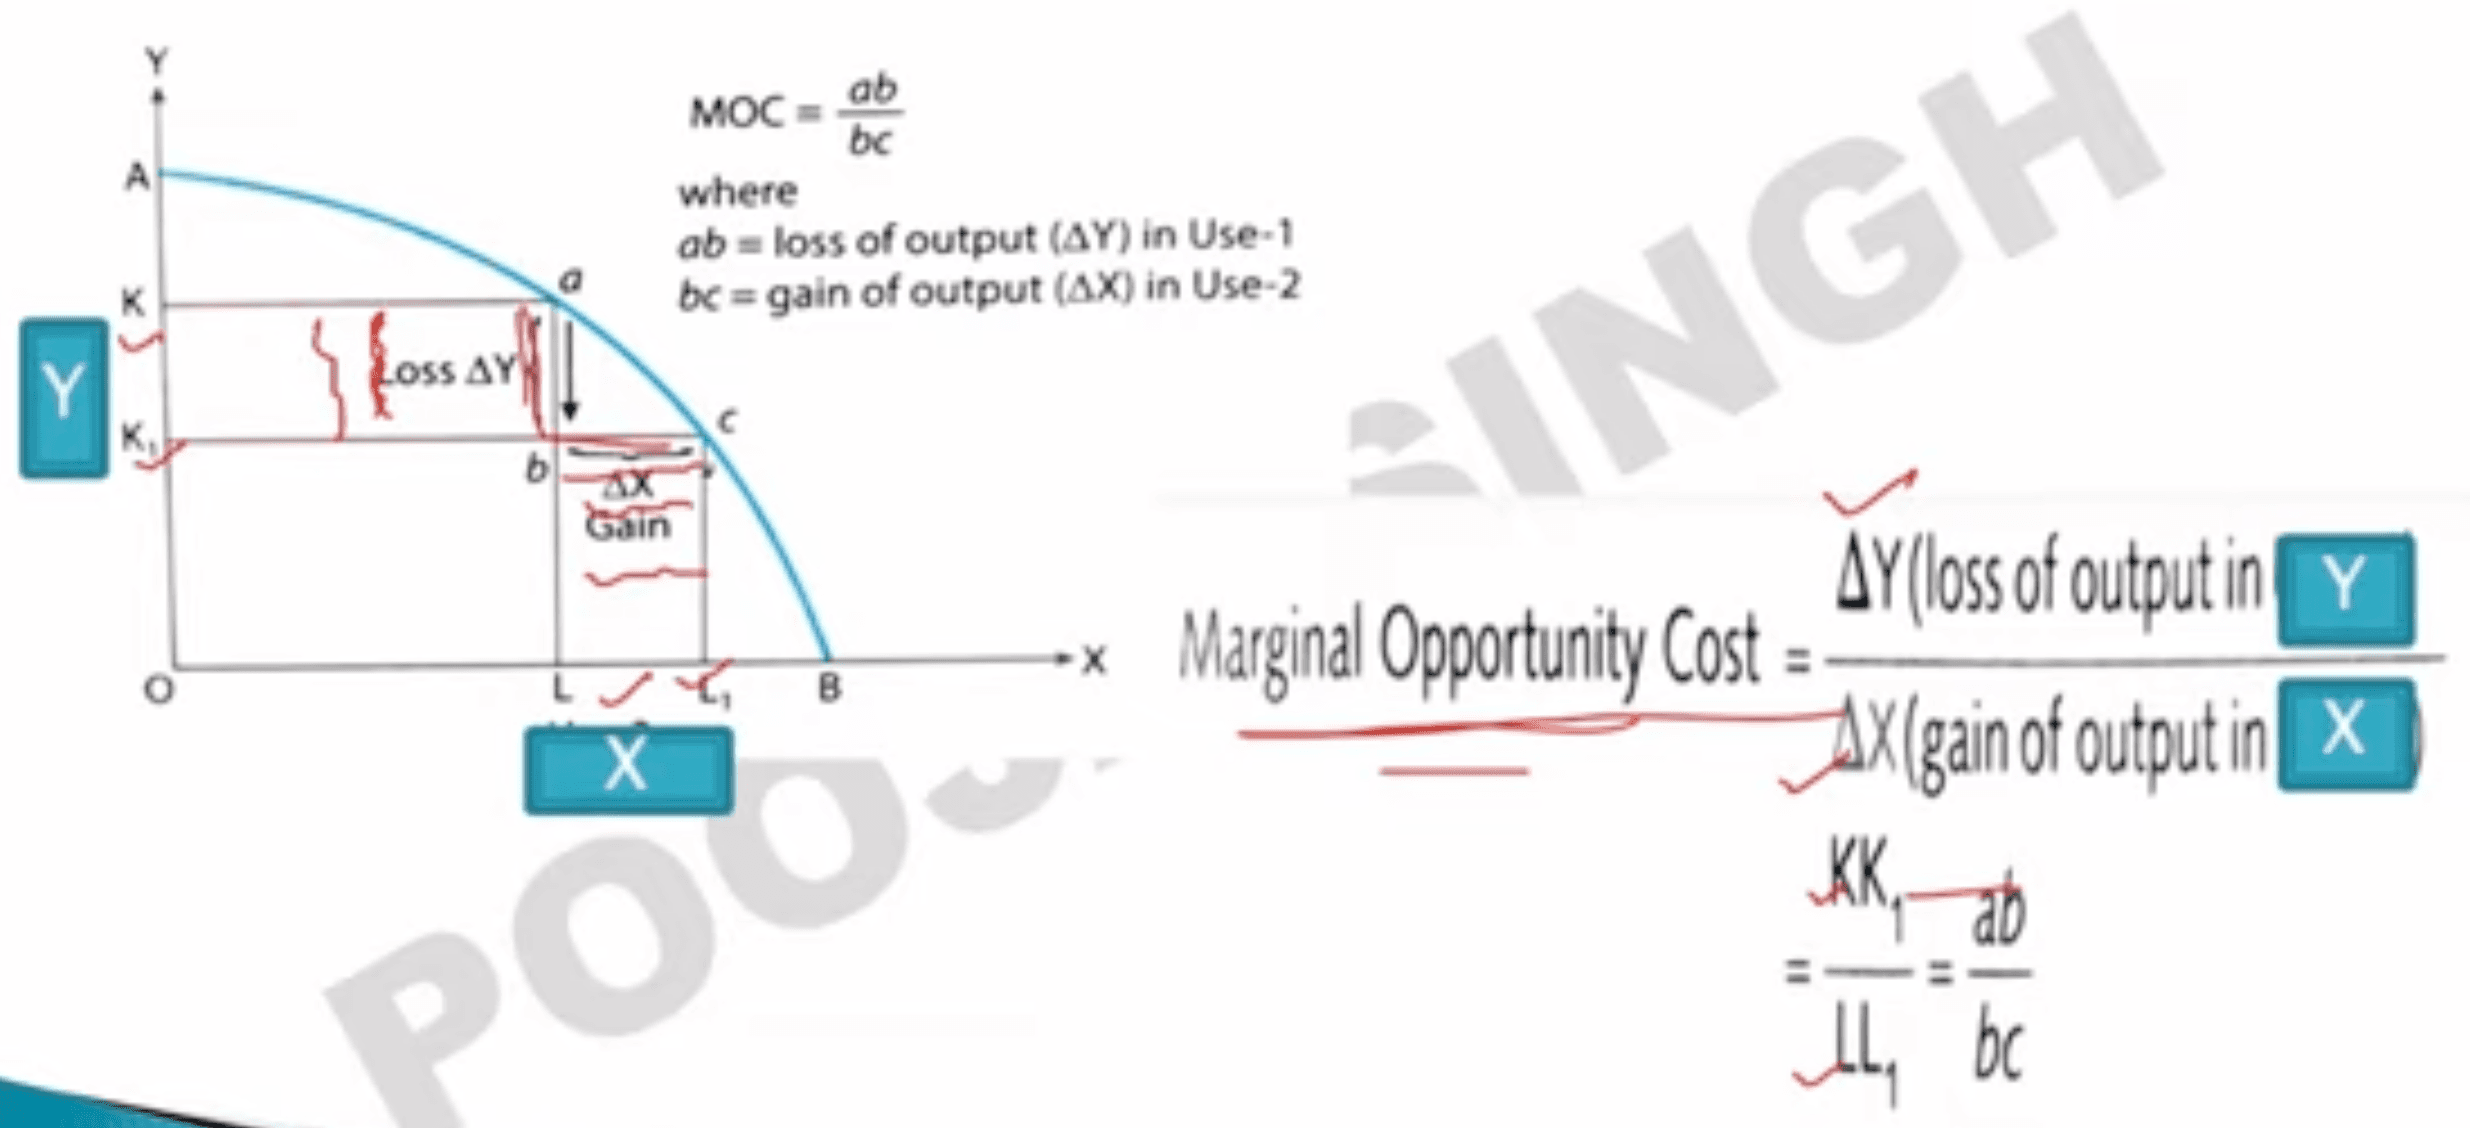
= Slope of production possibility curve
UTILITY
Is a term to determine the worth or value of a service or good. In other words, it is the total satisfaction or benefit derived from consuming a good or service.
- Satisfying power of commodity
Cardinal Measurement: Alfred Marshall measures satisfaction in terms of numbers. 2 utils, 4 utils.
Ordinal Measurement: Hicks ranked satisfaction as 'high' or 'low'.
Total Utility
Sum total of utility derived from consumption of all units of commodity.
Marginal Utility
Additional Utility derived on consuming another unit of commodity.
Relation b/w Total and Marginal Utility
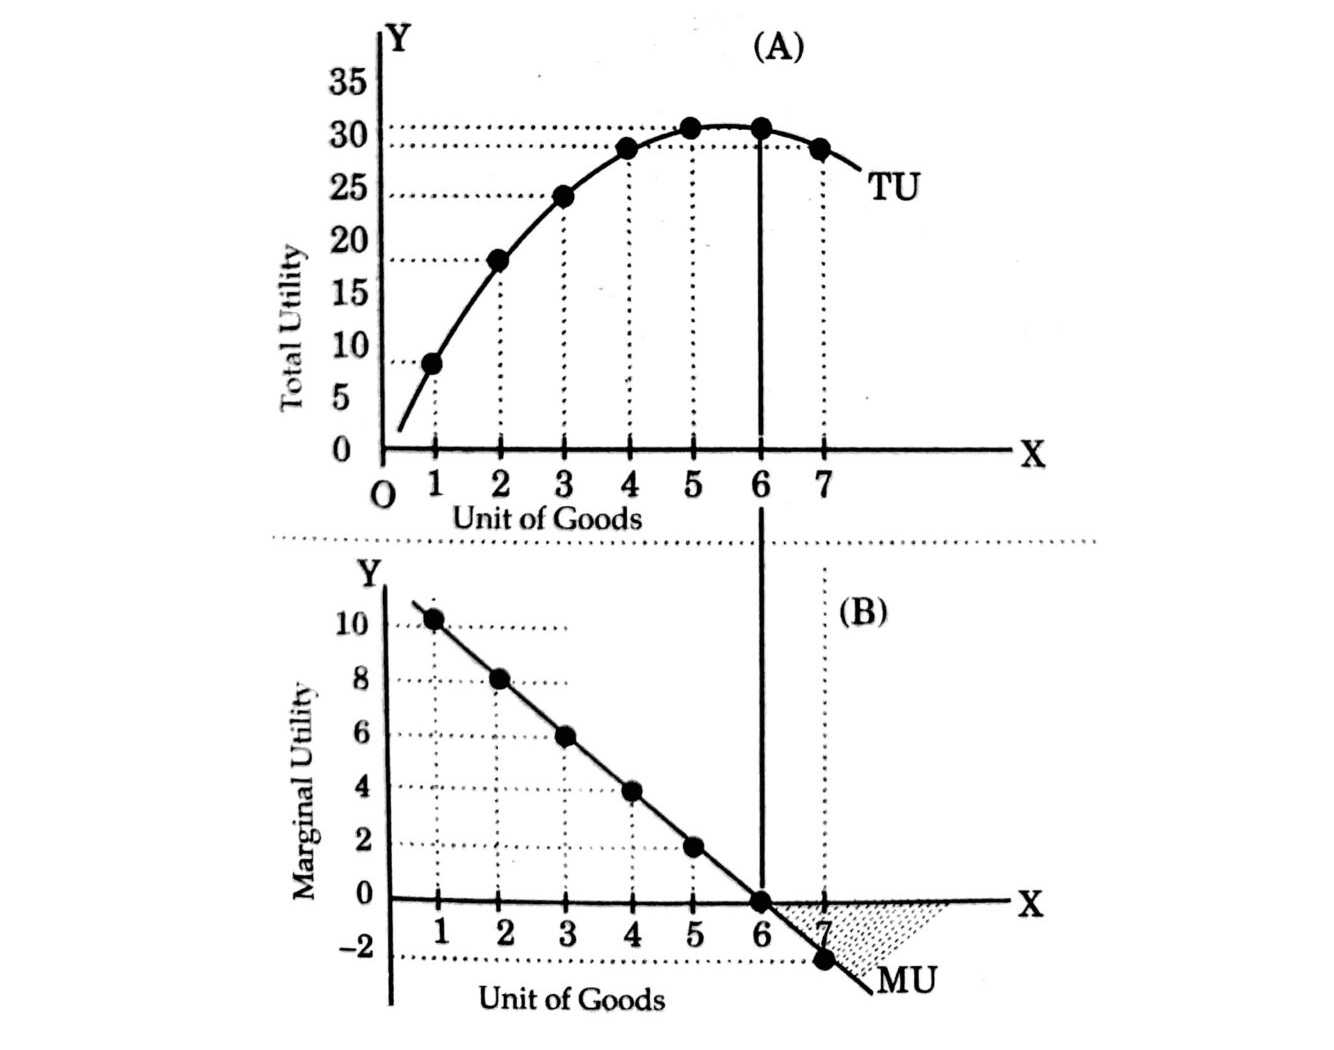
- Total Utility increases as long as Marginal Utility is +ve
- TU is maximum when MU = 0
- TU starts declining when MU is -ve
- Decreasing MU implies that TU increases at a decreasing rate.
- TU = Sum of MU
Law of Diminishing Marginal Utility
- Fundamental law of satisfaction / Psychological Law:
- As consumption of standard units of commodity becomes continuous, MU decreases
Consumer's Equilibrium
- When customer gets the maximum Satisfaction of his money's worth and has no tendency to change.
- When consumer plans his expenditure(based on his income and market price) to maximize his satisfaction. Utility analysis of Consumer's Equilibrium
- CE analysed based on Cardinal Measurement. Assumption
- All units of goods are homogeneous
- No change in taste during consumption
- No time gap between consumption
- Rational consumer
- Cardinal Utility
- Independent Utility : consuming one commodity doesn't effect other
- Marginal Unit of Money is constant
Marginal Unit of Money: How much a dollar cost? Worth of a rupee. Used to convert MU into rupee.
Equilibrium is when rupee worth of satisfaction a consumer expects to get match the rupee worth of satisfaction he actually gets.
Law of Equi-Marginal Utility:
The law states that a consumer should spend his limited income on different commodities in such a way that the last rupee spent on each commodity yield him equal marginal utility in order to get maximum satisfaction.
MUA / PA = MUB / PB = … = MUN / PN
Where MU’s are the marginal utilities for the commodities and P’s are the prices of the commodities.
Assumption:
- There is no change in the price of the goods or services.
- The consumer has a fixed income.
- The marginal utility of money is constant.
- A consumer has perfect knowledge of utility.
- Consumer tries to have maximum satisfaction.
- The utility is measurable in cardinal terms.
- There are substitutes for goods.
- A consumer has many wants.
Limitation of Utility Analysis: Assumption that utility can be expressed in cardinal numbers
Indifference Curve
Indifference curve analysis of Consumer's Equilibrium: CE analysis based on ordinal measurement of utility. (Hicks said : States - utility can be ranked high/more or low/less)
Assumption:
- Consumer's income is fixed
- consumer spends his income on substitute goods. (like tea and coffee)
- consumer's preference for two goods is well defined. (less goods, more want)
- Monotonic Preference: more goods always leads to more satisfaction
- consumer is rational. He tries to maximize his satisfaction.
Consumer is indifferent across combinations of two substitute goods, since all the different combinations offer the same level of satisfaction.
Together these combinations form an Indifferent set of consumer.
Indifference Curve: Graphical Representation of various combinations of two substitute goods with which the consumer is equally satisfied.
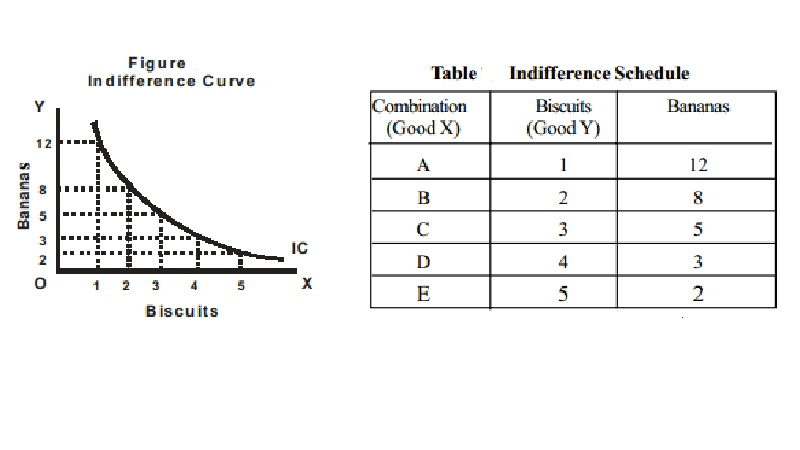
Properties:
- IC slopes downwards
- IC is convex to the origin
- Higher IC shows higher level of satisfaction
- IC's do not cross each other.
- IC's never touch x or y axis
Concave to Origin : slope rises from L -> R Convex to Origin : slope declines from L -> R
Marginal Rate of Substitution(MRS): Slope of Indifference curve Rate at which customer is willing to substitute one good for other.
DEMAND
Demand: Desire to buy to a commodity backed with purchasing power and willingness to spend.
Demand schedule - table for quantity demanded vs price by individual/market
 Demand Curve - Graphical Representation. Downward slope. Demand is inversely proportional to price.
Determinants of Demand:
- Price of commodity
- price of related goods increase in substitute's price leads to decrease in demand of commodity, while increase in complimentary's price leads to increase in demand of commodity.
- Income of customer
- Tastes and preferences
- Expectations of future + (market)
- Population
- Distribution of income
Law of Demand
Assuming other determinants of demand remain constant, demand of commodity decreases as its price increases.
Q. Why does Demand Curve slope downward? (Reason of law of demand)
-
Law of Diminishing Marginal Utility. As quantity increase, satisfaction decreases hence not worth the price. Hence, customer excepts lower price.
-
Income Effect. As price of a commodity decrease. Consumer can afford more quantity, hence real income and demand increase.
-
Substitution Effect As price of coffee increase, demand of tea will increase and demand of coffee will decrease.
-
Size of consumer group As price of a product decreases. More people are now afford the product. Hence increase in demand.
-
Different uses.
Exception to Law of Demand
- Status Symbol Goods - Veblen Effect. Eg: Mercedes, Apple, Gucci
- Giffen Goods: When price increase of non-luxury item. Can no longer afford other combination. Hence only buy more of that product. Hence, demand item.
- Irrational Judgement - More price = better product
Shift in demand curve
- Change in quantity demand: When price changes
- Change in demand: When change due to other determinants of demand
Elasticity of Demand
Measures responsiveness of quantity demanded of a good, due to change in
- its price - Price elasticity of demand
- price of related goods - Cross EOD
- consumer's income.- Income EOD
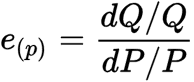
Price Elasticity of Demand
Measurement of percentage change in quantity demanded due to percentage change in own price.
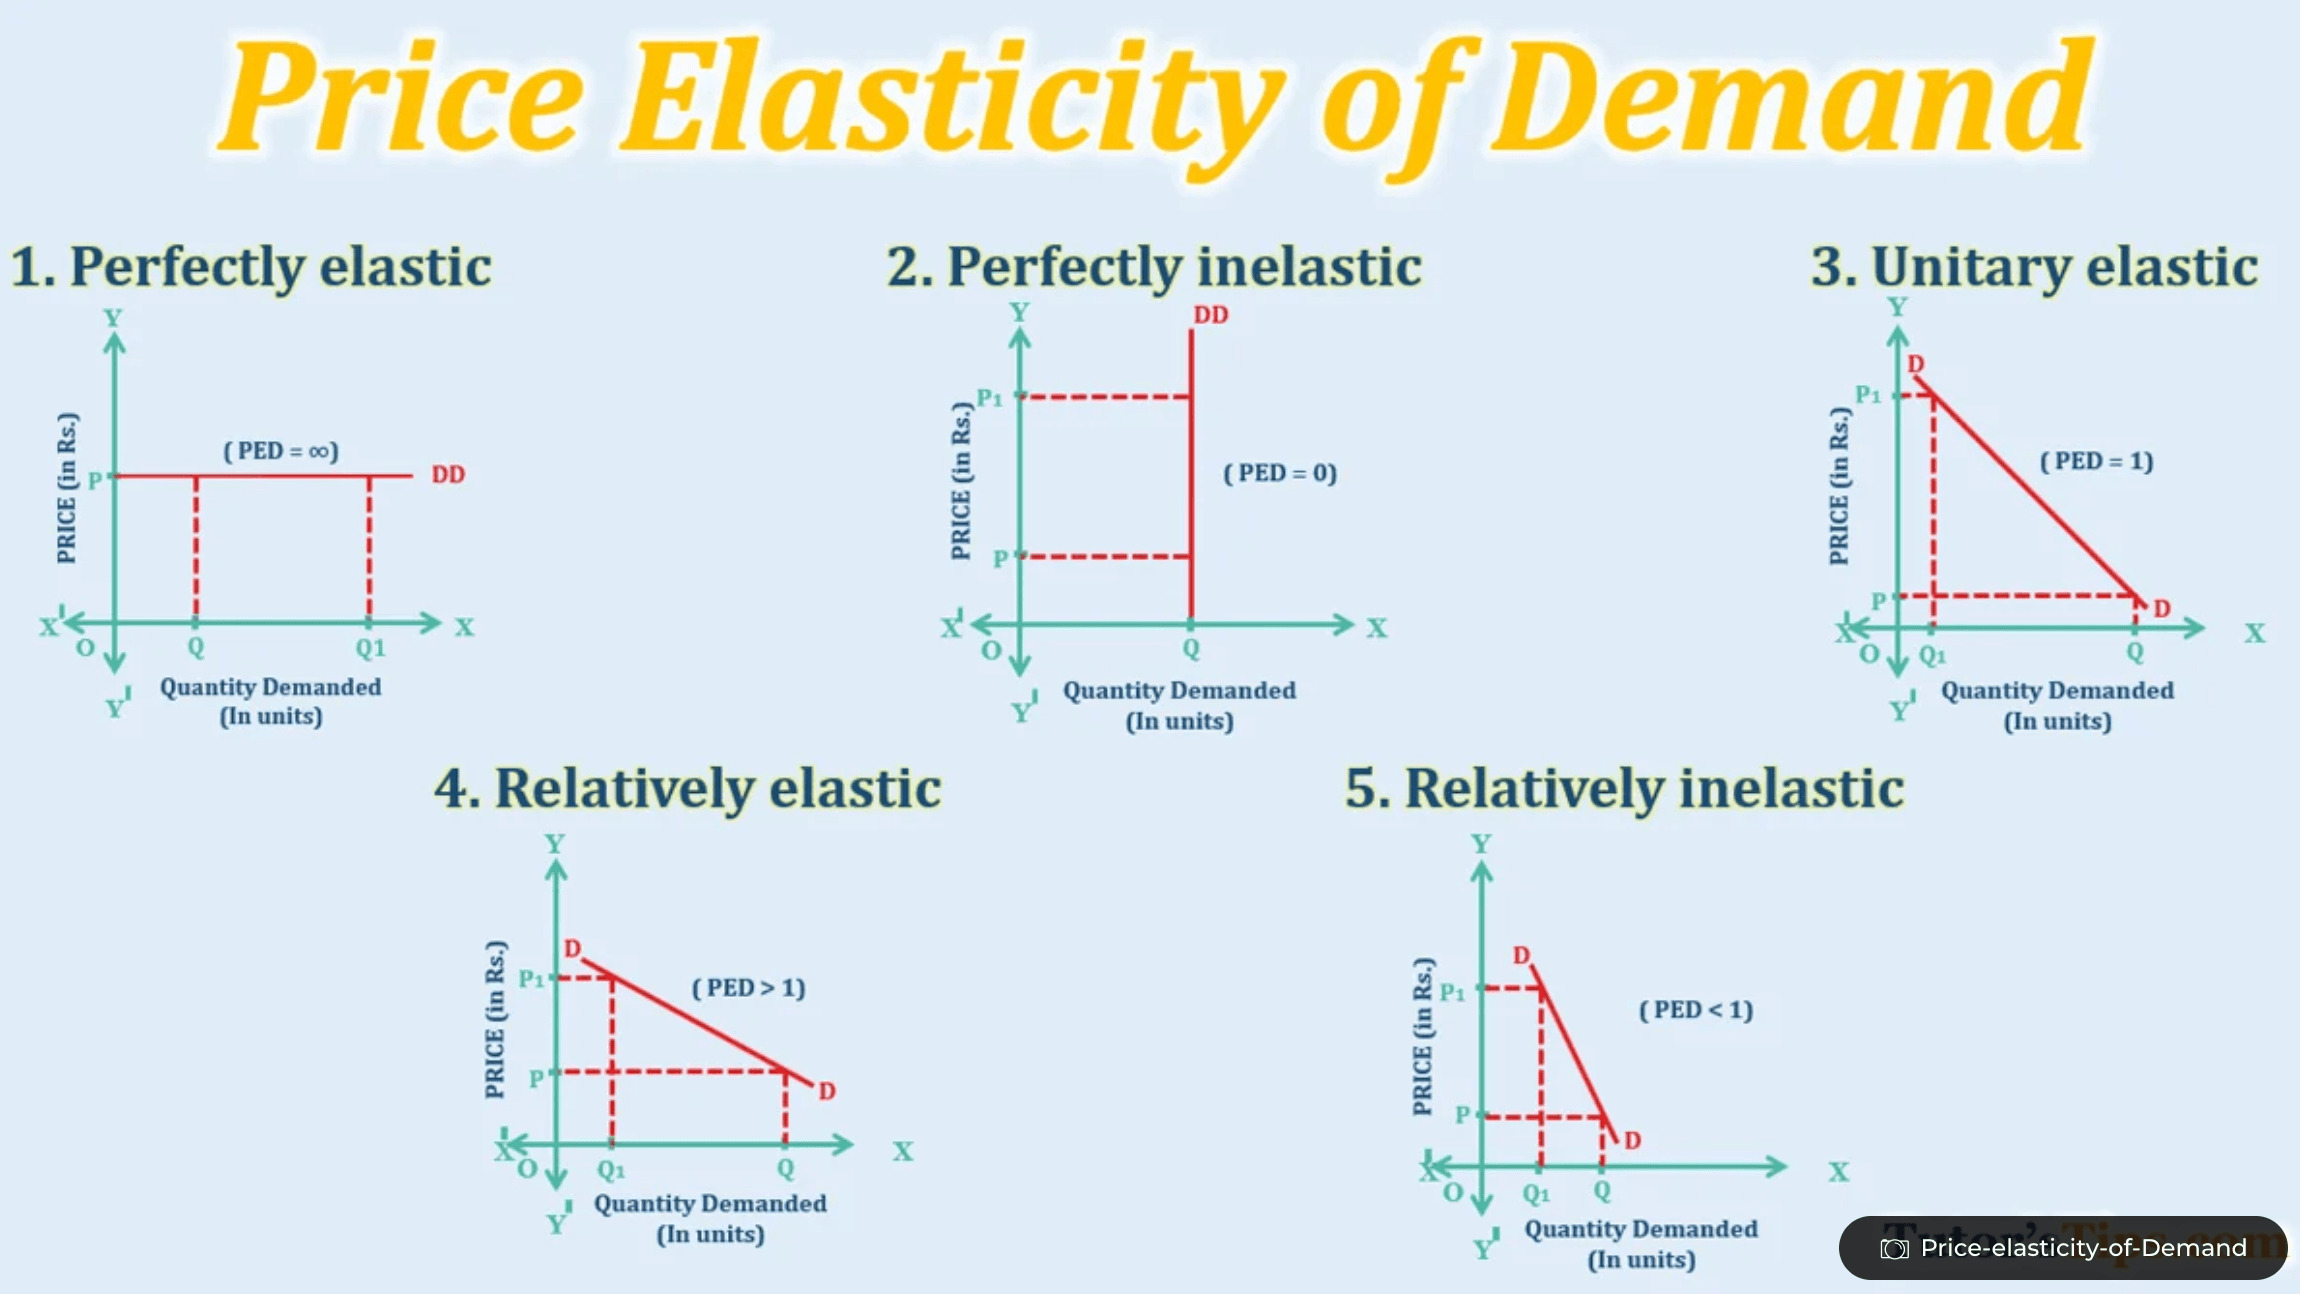
-
Higher the EOD - Flatter the curve
-
Perfectly Elastic: Sunlight
-
Relatively Elastic: Luxury items
-
Relatively Inelastic: Basic necessary
-
Perfectly Inelastic: Necessary Medicines
More EOD means same change in price will lead to more change in quantity demand.
Factors Affecting Price EOD
- Nature of Commodity: Necessary product's are Inelastic. While luxury elastic
- Availability of Substitute: If most substitutes of product are available. It will be more elastic
- Multiple Uses: If product with uses like milk price increases. We will only buy necessary uses by themselves with paneer and ghee. And it's demand will decrease. Hence, elastic.
- Postponement of use: Postponable goods are elastic. Like home/car. their demand changes with policies.
- Income of buyer: A broke dude is going to be more elastic. While rich dude keeps buying whatever he wants.
- Habit of consumer: Addiction. Eg: internet, alcohol are inelastic
- Proportional of income spent on a commodity: Cheap products. hence inelastic
- Time period small time period is inelastic. But longer elastic
Cross Elasticity of Demand
Measurement of percentage change in quantity demanded due to percentage change of it's related goods.
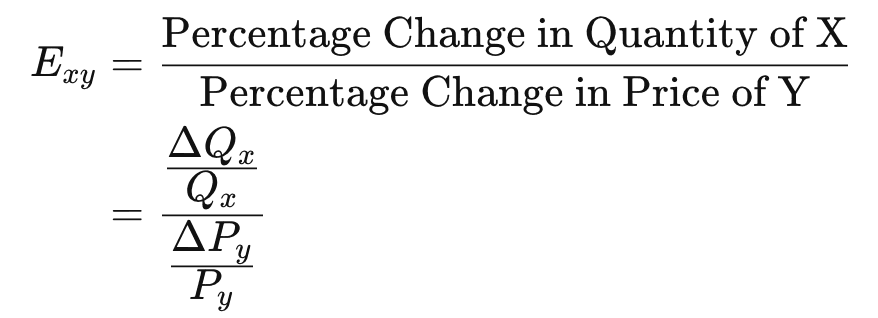
- related goods include complimentary and supplementary goods.
- Useful for businesses to make strategic decisions.
Cost
refers to the expenditure incurred by a producer on the inputs for the given outputs of a commodity.
Implicit Cost: Estimated expenditure on use of self-owned inputs Explicit Cost: Expenditure incurred by producer on purchase of inputs from market.
Total Cost: Implicit + Explicit Cost Opportunity Cost: value of next best alternative.
In economics, cost is always measured as opportunity cost.
Also, total cost = opportunity cost
Selling Cost: marketing cost Production Cost: money spend by producer (explicit or implicit) on input
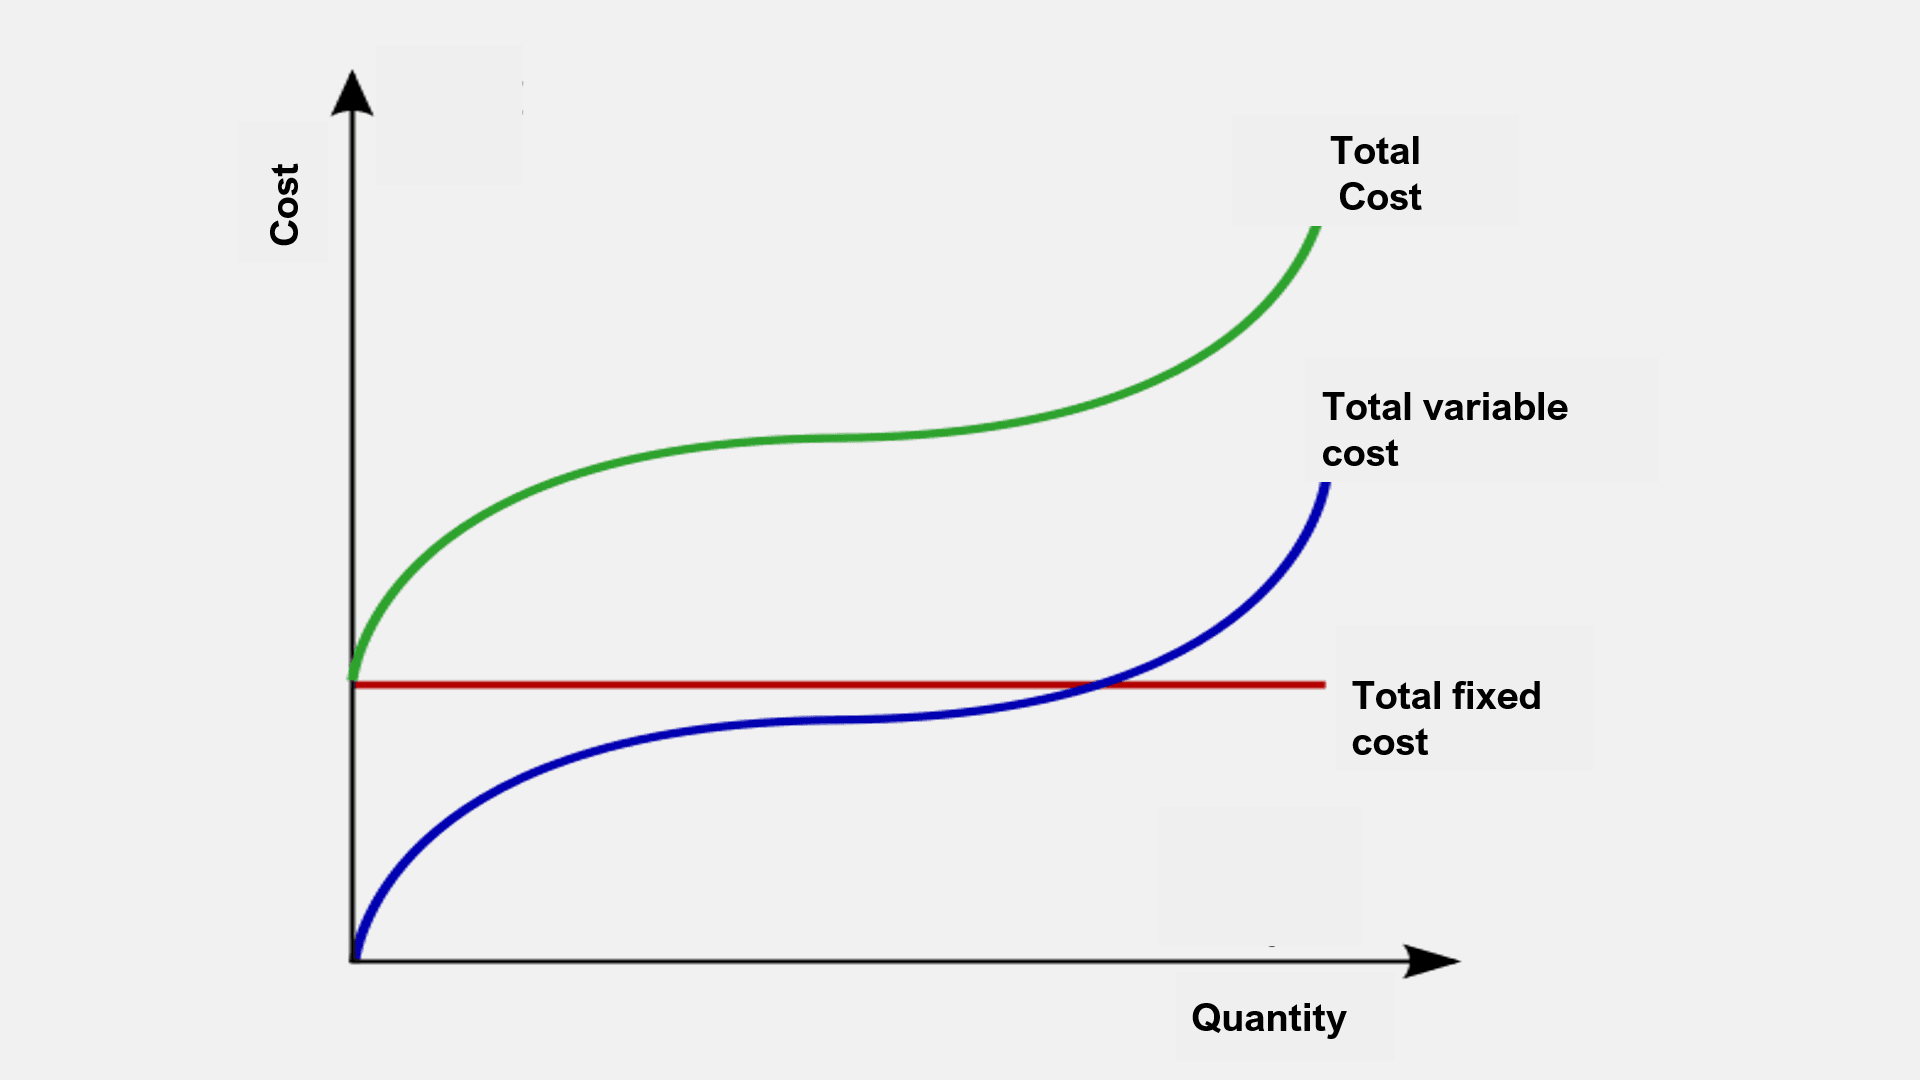
Short Run Cost: Period of time in which some factors are fixed and some are variable. Two components:
- Fixed Cost: expenditure on fixed factors. (One whose production quantity can't readily be changed. Example: major machinery, suitable land, key management personnel, etc)
- These cost do not change with volume of outputs.
- Fixed cost incur even when value is zero. Example: land tax, factory rent, machine costs, salary of employees
- Variable / Prime / Direct Cost: expenditure on variable factors. (One whose production quantity can be changed readily. Example: Raw material, labour, fuel, etc)
- These costs increase with volume of outputs.
- These costs are zero when no output is produces Example: cost of raw material, wages of labour, etc
Total Cost = Total Fixed Cost + Total Variable Cost
Average Cost
Cost per unit of output produced. Also known as Unit Cost of production
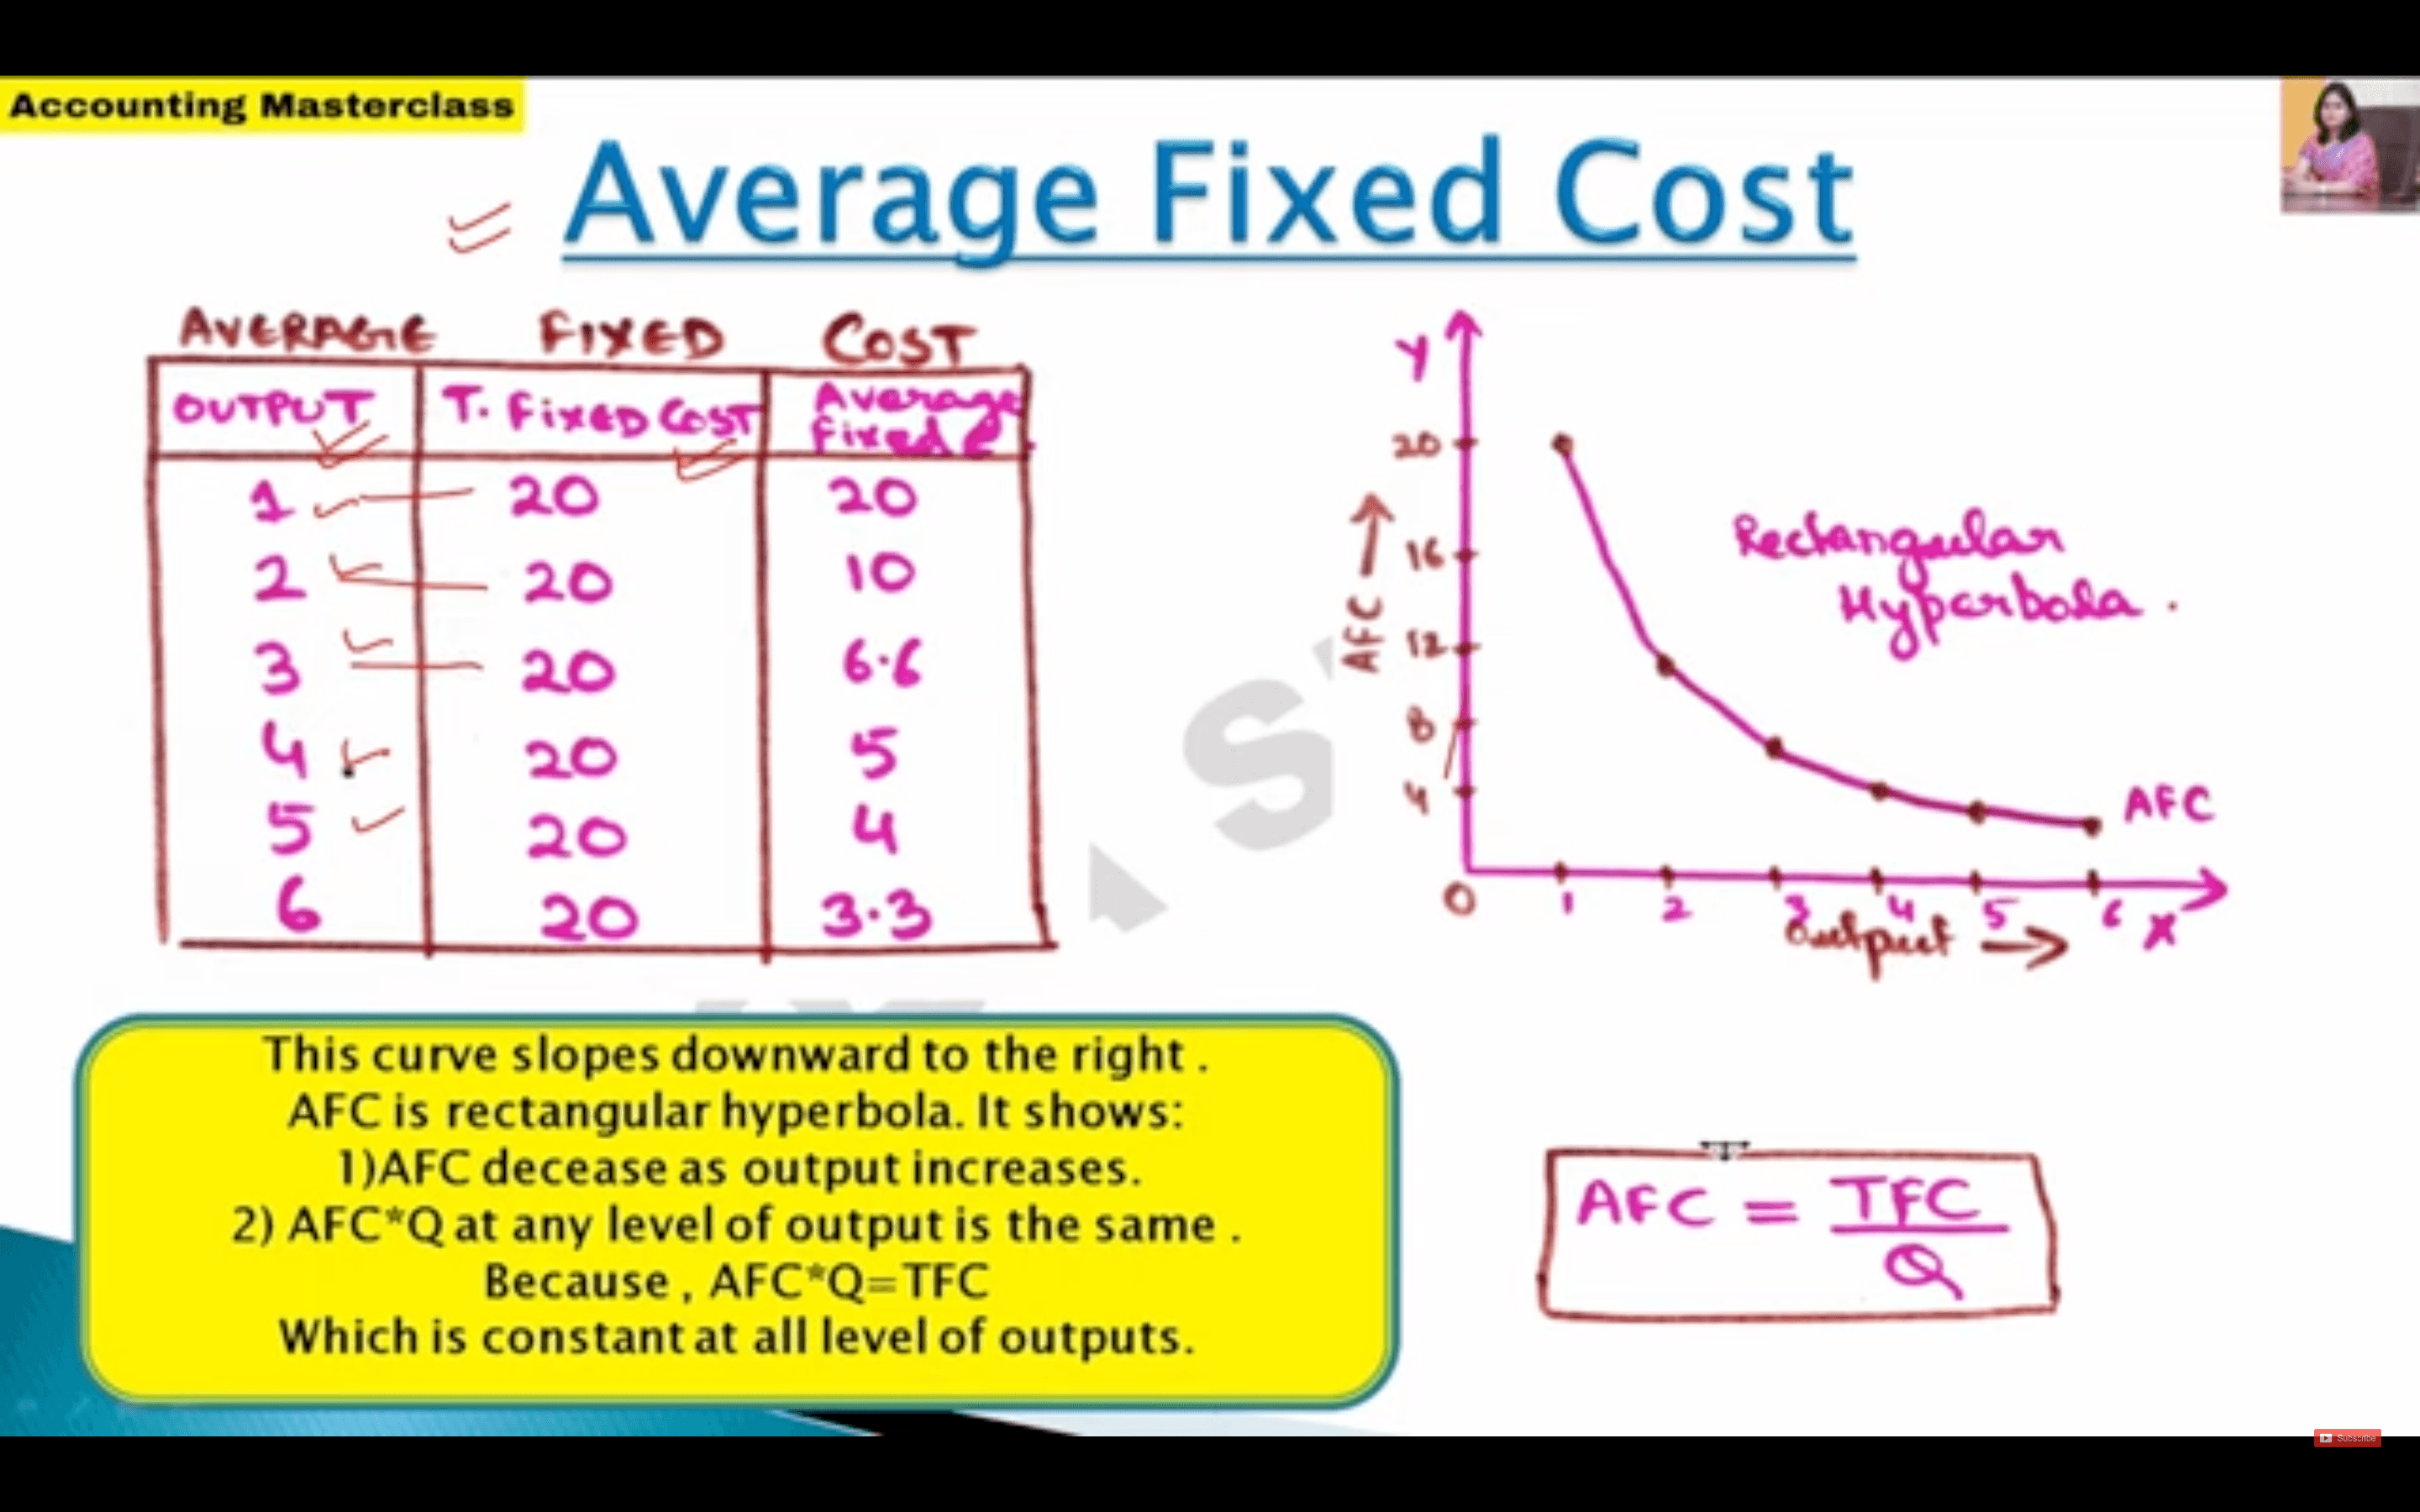
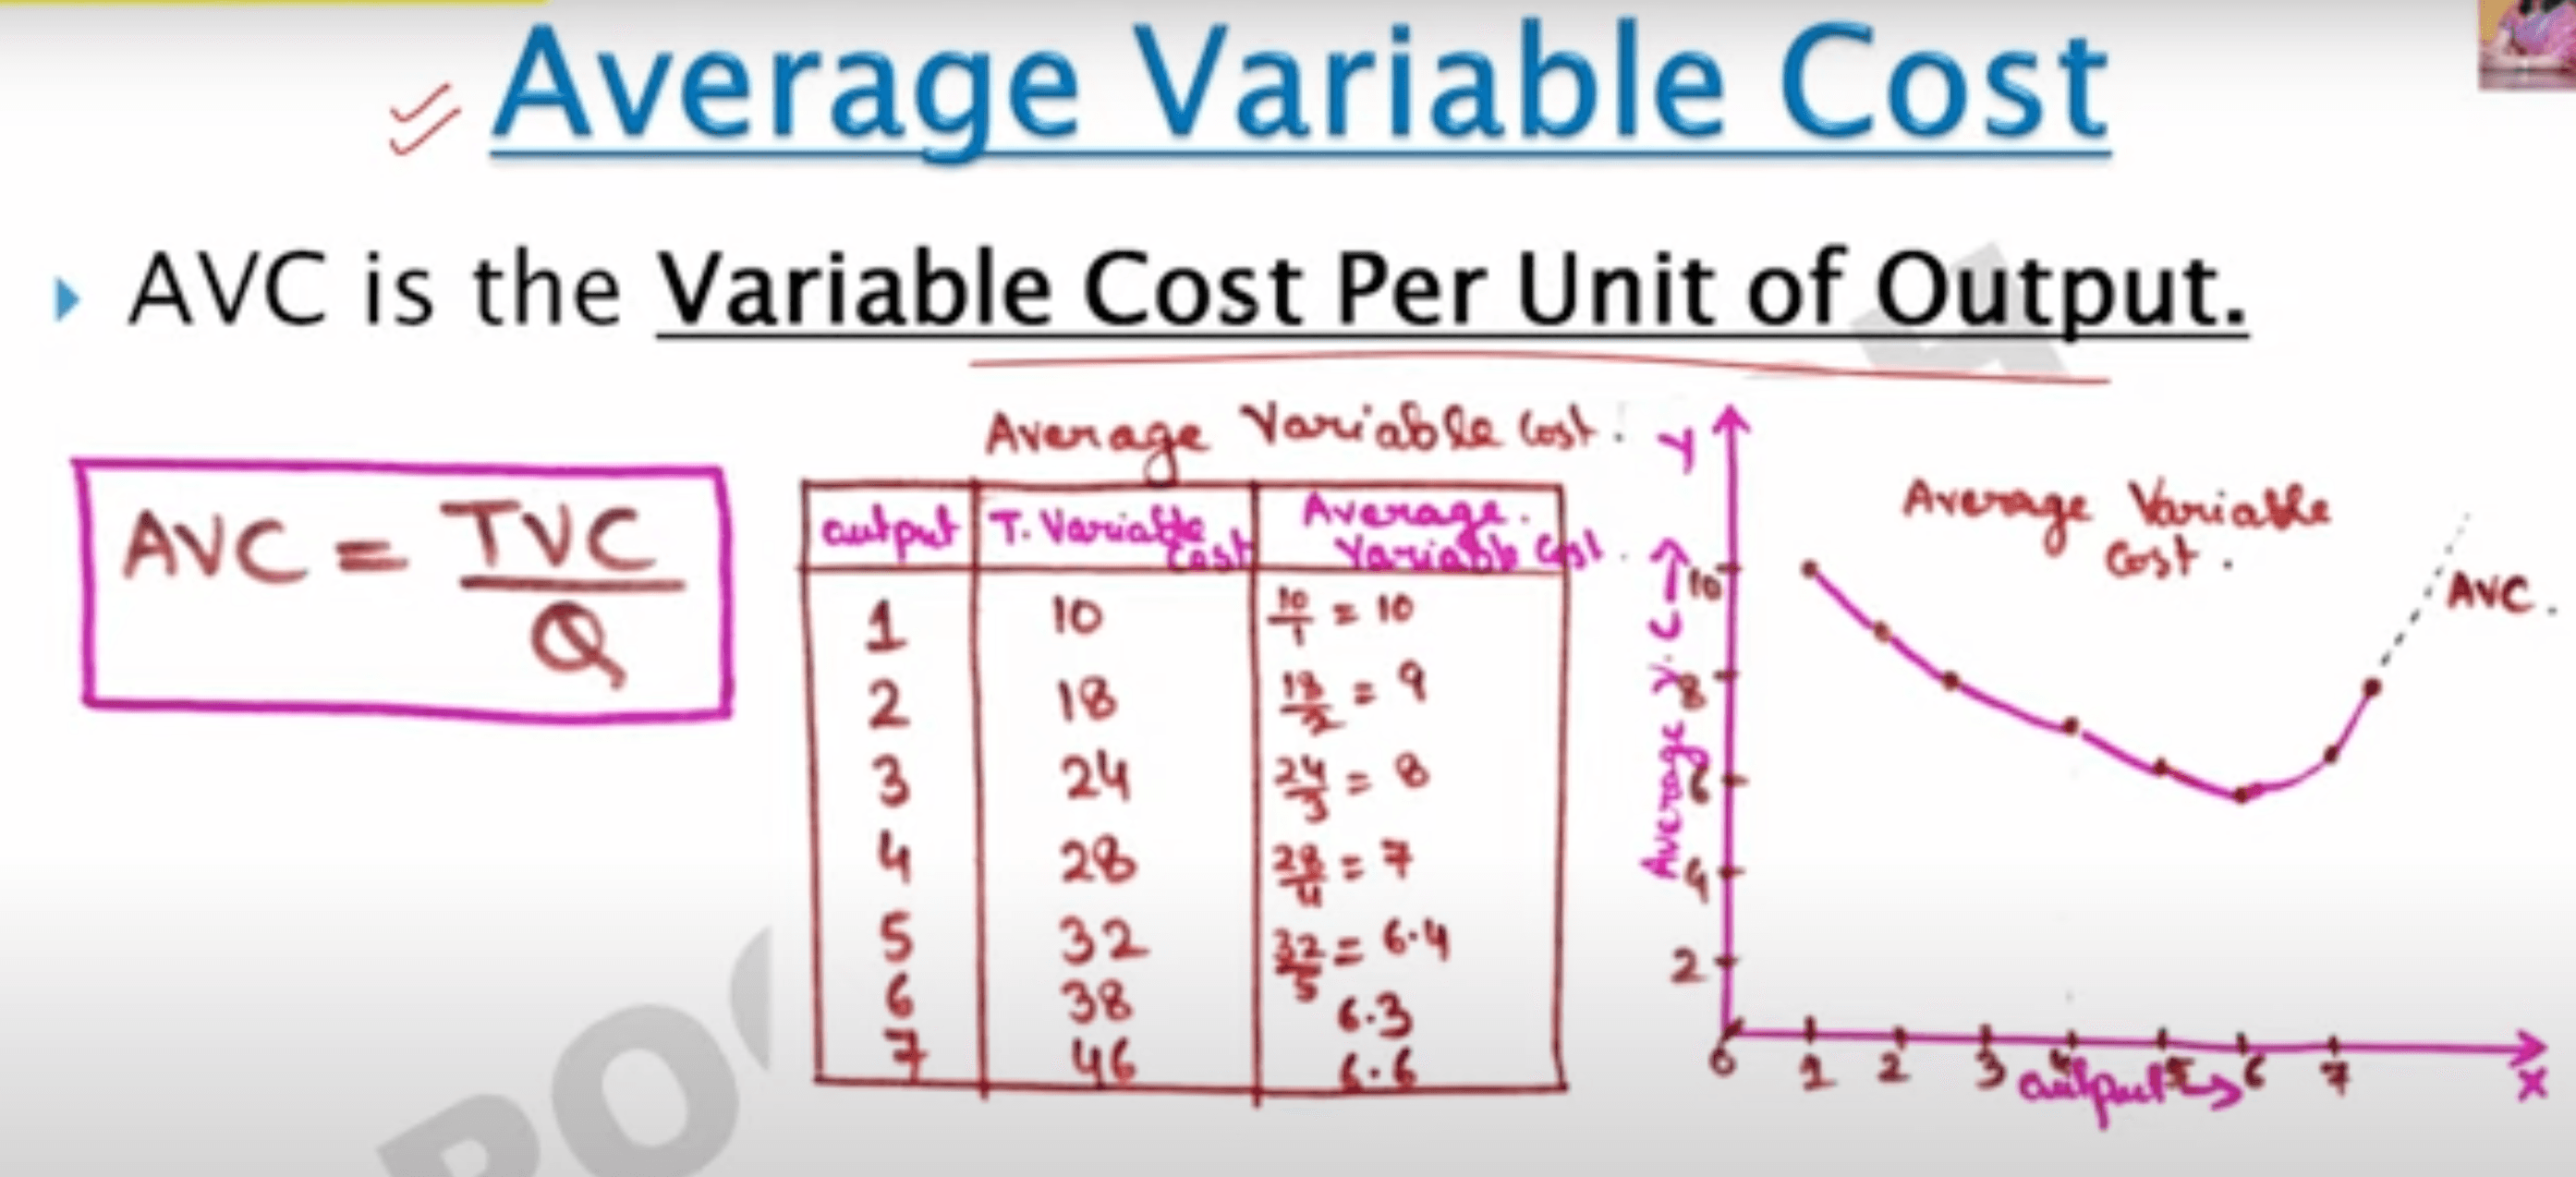
AC = Total Cost / Quantity AFC = TFC / Q AVC = TVC / Q
- U shaped because of law of variable proportions.
- Firstly output produced increases with increase of variable factors.
- But slow it diminishes and total product declines. Negative return
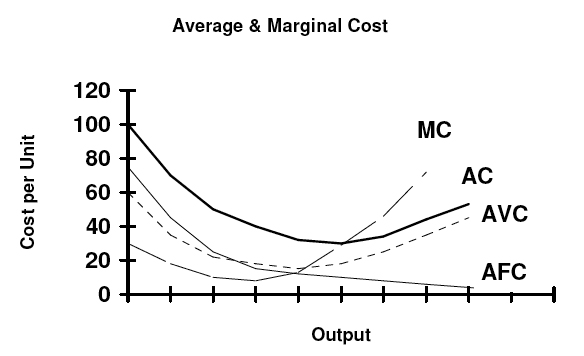
AC = AFC + AVC
- Short Period Average Cost is U shaped because of law of variable proportions.
- It tend to fall owing to increasing returns to a factor,
- It tend to stabilise owing to const returns to a factor
- It tend to rise owing to diminishing returns to a factor
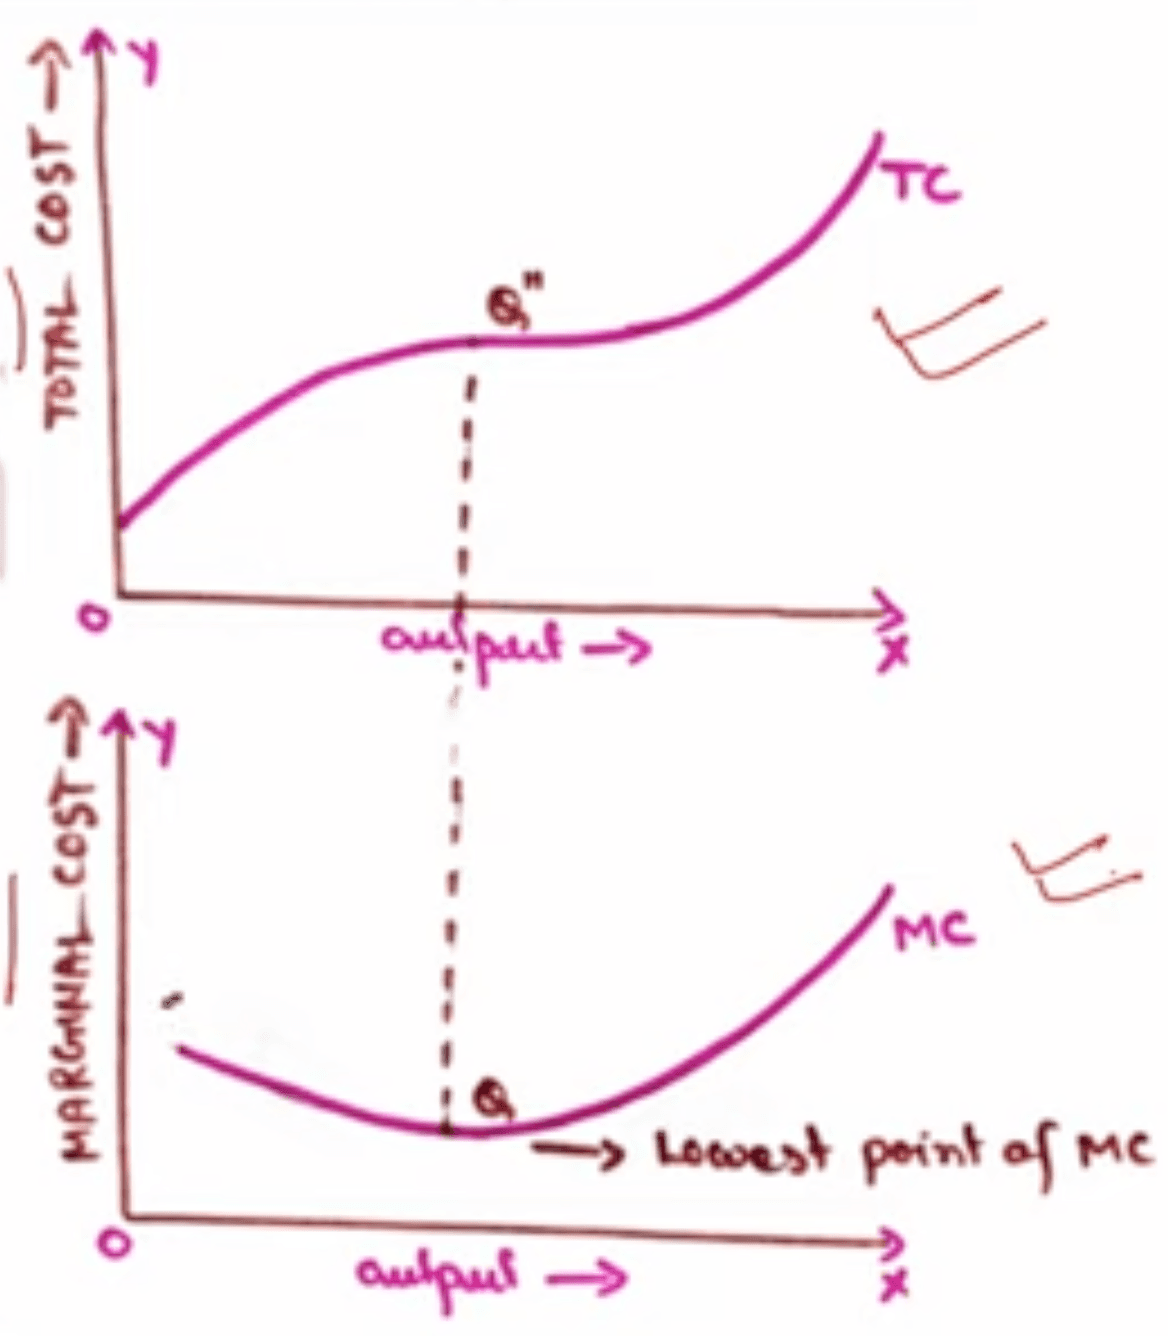
Marginal Cost: Change in total cost when an additional unit of output is produced.
MC = ðTC / ð Q MC = TC(n) - TC(n-1)
MC is inversely proportional to Marginal Product (change in output produced as a result of increased input).
Relation between Average and Marginal cost
- When AC is falling : AC > MC
- When AC is rising : MC > AC
- MC cuts AC at it's lowest point. i.e. AC = MC when AC is constant.
Relation b/w TC and MC
- When MC is diminishes, TC increases at a diminishing rate
- When MC is rises, TC increases at an increasing rate
- When MC reaches it's lowest point, TC stops increasing at a diminishing rate.
Relation between Total Product and marginal Product
When only one input is increased for increasing production, while keeping the other inputs constant. Law of Diminishing Marginal Product occurs.
- marginal product of that will fall.
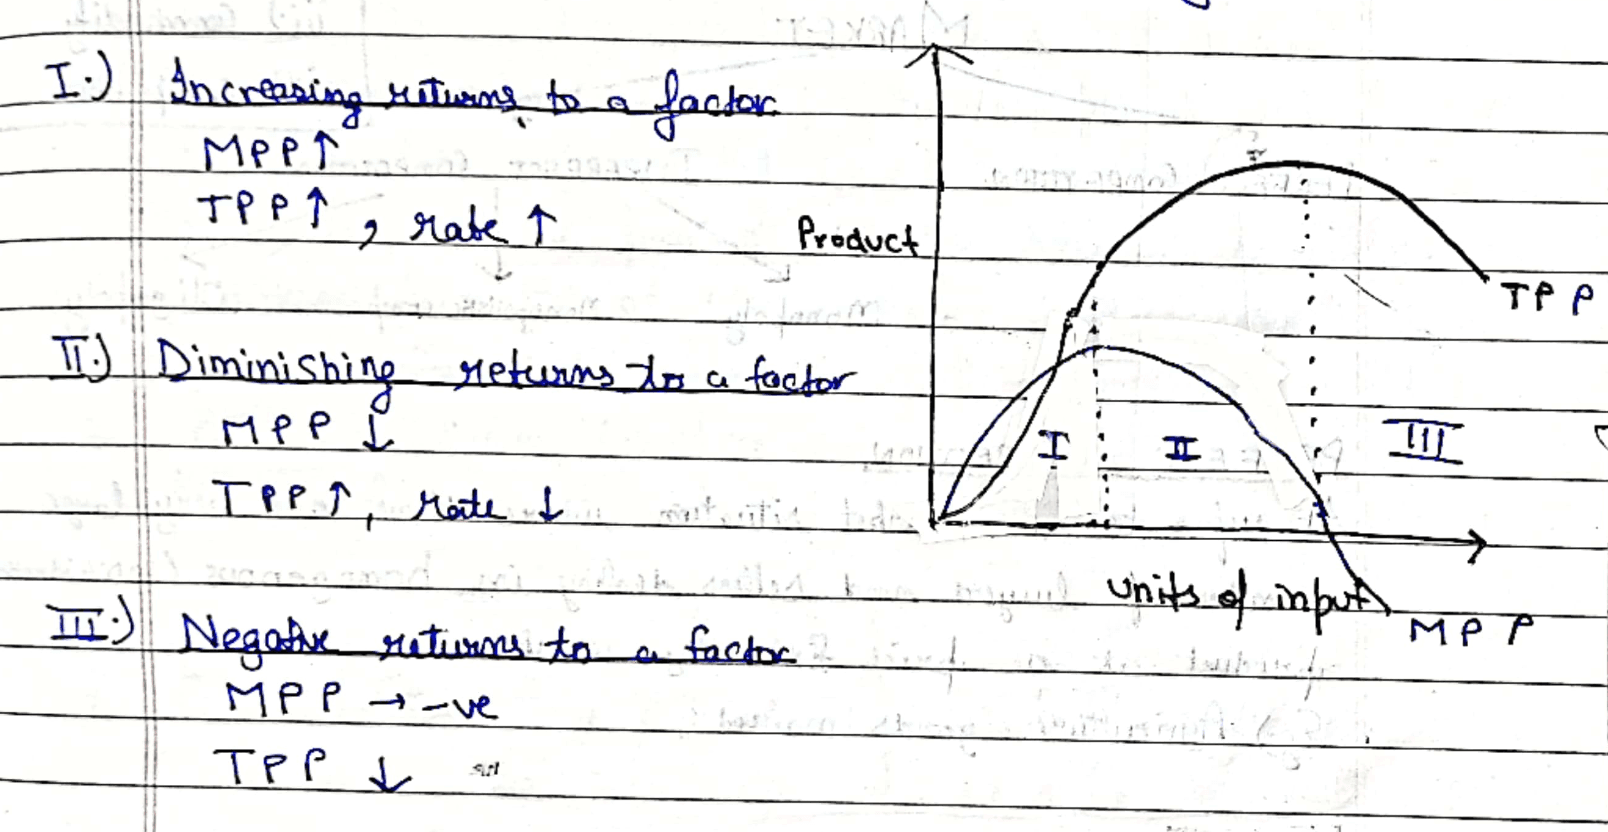
- Total product will increase at increasing rate with MP
- Then increase at decreasing rate with decreasing MP
- Then ultimately decline
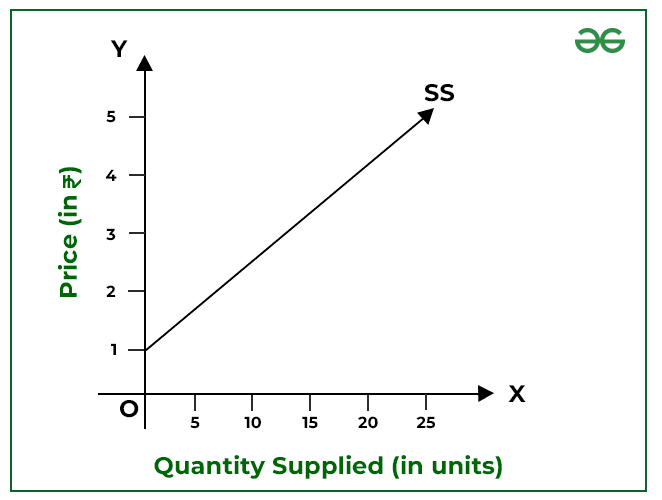
Law of Supply
If price of a commodity increases, producers will try to maximum their profits and increase its supply.
Exceptions to the Law of Supply
- Backward-Bending Supply Curve (Labor Market): At higher wage levels, workers may supply fewer hours as they prioritize leisure over additional income.
- Fixed Supply: For unique goods (e.g., land or art by a deceased artist), the quantity cannot increase regardless of price.
MARKET
Any place or system which brings sellers and buyers together to exchange goods or services to make a living.
Market Equilibrium: Supply = Demand
Structure/Form of Market
- Perfect
- Imperfect : Monopoly, Monopolistic Competition, Oligopoly
Perfect Competition
- Theoretical Ideal market with no monopolies.
- Large number of small-sized seller and buyers.
- Homogeneity - All selling identical products. Eg: fruits
- All firms are price takers, not price makers. (No one can influence market price)
- Price is determined by force of market supply and demand
- Buyers have complete / perfect information about the product being sold.
- Constant or zero transportation cost.
- Free entry or exit. and independent decisions. No government barrier.
- Homogeneous
- Demand Curve of firm under perfect competition is Perfectly Elastic
- Firms only earn normal profit in the long run
Monopoly
Market where only a single seller of a product is controlling the market without any close substitution. Example : Railways
- One seller and large no. of buyer
- Restriction on entry of new firm
- No close substitute
- Full control over price. (price maker)
- Possibility of price discrimination. (different prices of different buyers).
Demand Curve for a monopoly firm Price control doesn't mean demand control. Still downwards slopping.
how arise?
- government licence / control
- Patent right
- Natural occurrence
Monopolist Competition
Industry in which many firm offers product/services that are similar substitutes. Example: Soap, Shampoo
- Monopoly + Perfect competition
- Partial control over price
- Large no. of (larger and small) sellers and buyers
- Selling costs
- downwards slopping demand curve
- Freedom of exit and entry
- Lack of perfect mobility and knowledge
Oligopoly
Market with small no. of large sellers where each firm exert a significant control over a given market. Example: Airtel, Jio, VI.
- Large no. of buys
- Price and output decision of one firm significantly effects of price/output of another rival firms.
- High degree of interdependence. (cut throat competition)
- Not possible to determine firm's demand curve
- Formation of Cartel
- Entry barrier
- Non - price competition. (service, marketing, etc)
UNIT ONE COMPLETED
Almost
- Marginal Rate of substitution
Goods
Any commodity or service which gives satisfaction to human beings on consumption.
Types of Goods
- Normal Goods:
- Demand increases with customers income.
- Everyday items. Example: branded clothes
- Inferior Goods:
- Demand increases as customers income rises
- Negative income elasticity demand
- Example: instant noodles, public transport
- Giffen Goods:
- Non-luxury items for which demand increases with price, defying law of demand
- Since it becomes costly but is necessary, we cut of related goods to buy more of this
- Free Goods:
- No price since supply is more than demand.
- Example: Sun rays, air
- Economic Goods:
- Less is supply since demand is more than supply.
- Example: Food, clothes...
- Capital goods:
- goods which help in production of other goods
- Example: machines and raw material
- Consumer Goods:
- Directly consumed by humans
- Example: bread and milk
- Public Goods:
- Non-excludable and non-rivalrous since public use
- Example: air, road, river
- Private Goods:
- Owned by a person, rivalrous and prevents others from using it
- Example: House, Car, food.
- Complimentary and Substitute
- Material(land, water, fish) and Non-material(skills, beauty, quality, knowledge)
- Veblen Goods (luxury)
- Transferable and Non-transferable goods
Money
Any item or verifiable record that is generally accepted as payment for goods and services and repayment of debts in an economy.
It serves as a medium of exchange and is essential for facilitating transactions and economic activities.
Functions of Money
-
Medium of Exchange
- Money is used to buy and sell goods and services, eliminating the inefficiencies of the barter system.
- It enables transactions by providing a commonly accepted medium that all parties are willing to accept.
-
Standard value / Unit of Account
- Money provides a standard measure of value, making it easy to compare the worth of different goods and services.
-
Store of Value
- Money can be saved and retrieved in the future, retaining its value over time. It allows individuals and businesses to defer consumption or investment until a later period.
-
Standard of Deferred Payment
- Money facilitates transactions that involve credit or future payments. It allows for contracts and agreements to be made for payment at a later date.
-
Liquidity
- Money is the most liquid asset, meaning it can easily be converted into other forms of assets or goods without losing value. This liquidity ensures that money can be quickly used for transactions.
- Example: Cash or balances in a checking account.
Qualities of Good Money
- General Acceptance
- Durable: does wear out of time
- Portable: easy to transport
- Homogeneity: identical
- Malleability: unique stamp of central bank
- Stability of Value: value doesn't fluctuate too much
Central vs Commercial banks
Commercial Banks are financial institutions that offer various banking services to individuals, businesses, and other entities. Examples include SBI and HDFC Bank. Their primary functions include:
-
Accepting deposits from the public.
-
Providing loans for personal and business use.
-
Offering investment services and facilitating transactions like online banking or cheque processing.
Credit Creation: By lending a portion of their deposits while keeping a fraction as reserves, they create additional purchasing power in the economy. Create profit from interests and generate more money in paper than it reality.
Central Banks are the highest financial authorities in a country, like the Reserve Bank of India (RBI). Their main roles are:
-
Issuing currency and maintaining the money supply.
-
Regulating and supervising commercial banks.
-
Implementing monetary policy to control inflation and ensure economic stability.
-
Acting as a lender of last resort during financial crises.
Custodian of Reserves: Commercial banks must keep a portion of their deposits as reserves with the central bank. Also known as Cash Reserve Ratio. Encourage Competition by deregulating certain policies and ensuring commercial banks operate efficiently
Key Differences:
-
Commercial banks directly interact with individuals and businesses, while central banks oversee and regulate these commercial banks.
-
Central banks are responsible for maintaining economic stability and implementing monetary policy, while commercial banks focus on providing financial services and generating profit.
-
Central banks are state owned, while commercial may be private or state owned.
-
CB are custodian of foreign exchange of the country while commercial banks need CB's approval.
Monetary policies can directly influence employment levels by:
- Increasing Aggregate Demand:
- Lower interest rates encourage more consumer spending and investment, leading to higher demand for goods and services. To meet this increased demand, companies hire more employees.
- Combating Deflation:
- Deflation can lead to reduced business revenues and layoffs. The central bank can increase the money supply, boosting spending and preventing deflationary spirals.
- Encouraging Entrepreneurship:
- By making loans cheaper and more accessible, the central bank can encourage young people to start their own businesses, contributing to employment generation.
Taxes and Indirect Taxes
- A tax is a financial charge or levy imposed by a government on individuals, businesses, or transactions.
- Taxes are mandatory and are used to fund government activities and public services.
- Not paying will result in legislative punishment.
Different Types of Taxes
1. Direct Taxes:
-
These are taxes that are paid directly to the government by the person or organization on whom they are imposed.
-
Examples:
- Income Tax: You pay a percentage of your earnings as tax.
- Wealth Tax: Tax on your property or assets.
-
Key Point: The tax is collected directly from the individual who bears the burden of the tax.
2. Indirect Taxes:
-
These are taxes that are applied to goods and services, and are paid indirectly by consumers when they purchase those goods and services.
-
Examples:
- Goods and Services Tax (GST) or Value-Added Tax (VAT): Tax added to the price of goods and services.
- Excise Duty: Tax on specific products like alcohol, cigarettes, or fuel.
-
Key Point: The tax is collected from the seller, but the consumer ultimately bears the cost since the tax is included in the price of the product.
Subsidy
Financial assistance given by the government to individuals or businesses to reduce costs and encourage production or consumption.
The government essentially “supports” certain goods or activities by reducing the price for consumers or producers.
- Taxes: government takes money to fund it's services and activities
- Subsidies: government gives money, to support certain activities
- Fees: you pay for specific government service
Inflation
Inflation is the increase in the general level of prices for goods and services in an economy over a period of time. When inflation occurs, the purchasing power of money decreases, meaning you can buy less with the same amount of money.
Prices rise due to an increase in the money supply in circulation without a corresponding increase in output.
-
Moderate Inflation (Good): Inflation around 2-3% per year is generally good for the economy. It encourages people to spend and invest because they expect prices to rise in the future. This can lead to economic growth.
-
High Inflation (Bad): Inflation say 10% or more is bad, it reduces the purchasing power of money quickly. People may find it hard to afford basic goods and services, which can lead to lower economic growth and even recessions.
-
Deflation (Too Low/Negative Inflation): If inflation is negative (deflation), prices fall, and people may delay spending, expecting even lower prices in the future. This can lead to reduced economic activity and job losses.
Types of Inflation
a) Demand-Pull Inflation
- Cause: Occurs when aggregate demand exceeds aggregate supply in the economy.
- Example: During an economic boom, consumer spending increases significantly, but if production doesn’t keep up, it leads to price increases across various sectors.
b) Cost-Push Inflation
- Cause: Arises due to an increase in production costs, such as wages or raw materials, which reduces the supply of goods and services.
- Example: A sudden increase in oil prices raises transportation costs, leading to increased prices of all goods that require transportation.
c) Built-In (Wage-Price) Inflation
- Cause: Occurs when businesses raise prices in anticipation of rising costs, and workers demand higher wages to maintain their purchasing power, creating a cycle.
- Example: If workers expect a 10% inflation rate, they demand a 10% salary increase. Businesses, in turn, raise prices further to cover these higher wages.
d) Hyperinflation
- Cause: Extremely rapid inflation caused by excessive printing of money or loss of confidence in the currency.
- Example: Zimbabwe’s hyperinflation in the late 2000s led to prices doubling within hours, due to a massive increase in money supply without a corresponding rise in production.
e) Stagflation
- Cause: Occurs when an economy experiences stagnation (no growth) along with high inflation and unemployment.
- Example: The 1970s oil crisis led to stagflation in many Western countries, as high oil prices increased costs, while economic growth remained low.
What is Monetary Policy?
Monetary Policy refers to the actions taken by a country’s central bank to control the money supply, availability of money and interest rates to achieve economic stability.
What is Fiscal Policy?
Fiscal Policy is the use of government spending and taxation to influence the economy. The government can increase or decrease spending and adjust tax rates to control economic activity.
How Monetary and Fiscal Policy Control Inflation:
-
Monetary Policy: The RBI can increase or decrease interest rates and use other tools to control inflation.
- To Reduce Inflation: The RBI increases interest rates, making borrowing more expensive. This reduces the amount of money circulating in the economy, leading to lower spending and slower price increases.
- To Encourage Spending (When Inflation is Low): The RBI lowers interest rates, making borrowing cheaper, which encourages spending and investment.
-
Fiscal Policy: The government can control inflation by adjusting spending and taxes.
- To Reduce Inflation: The government can reduce its spending or increase taxes. This pulls money out of the economy, reducing demand for goods and services, which helps slow down inflation.
- To Stimulate Economy (When Inflation is Low): The government can spend more or cut taxes, putting more money into people’s hands, increasing demand and boosting economic activity.
Tools of Monetary Policy Used to Control Inflation in India:
The Reserve Bank of India (RBI) uses several key tools to control inflation:
-
Repo Rate:
- This is the rate at which the RBI lends money to commercial banks. If the RBI increases the repo rate, it becomes more expensive for banks to borrow, so they raise interest rates for consumers and businesses. This reduces borrowing and spending, helping to lower inflation.
-
Reverse Repo Rate:
- This is the rate at which the RBI borrows money from commercial banks. When the RBI increases the reverse repo rate, banks are encouraged to park more funds with the RBI because they get a better return. This reduces the money supply in the economy, helping to control inflation.
-
Cash Reserve Ratio (CRR):
- The RBI can increase the CRR, which is the percentage of total deposits that banks must keep with the RBI as reserves. A higher CRR means banks have less money to lend, which reduces the money supply and controls inflation.
-
Open Market Operations (OMO):
- The RBI buys or sells government securities in the open market to regulate the money supply. If the RBI wants to reduce inflation, it sells securities, which pulls money out of circulation.
-
Statutory Liquidity Ratio (SLR):
- Minimum amount of deposits that every commercial bank. need to keep to them in form of liquid cash and other assets. Increase this ratio.
National Trade vs Internation
- Buying and selling within the same country. No taxes, currency bullshit, low risk
- Internation: minimum two countries, taxes, restrictions, high opportunity cost and risk
Dumping
Sale of good abroad at a price lower than the selling point of the same good at home
International
- Occasional foreign sales below home price
- To drive off existing foreign market
- To set foot hold
- To dispose off occasional domestic supplies
Persistent
- Continuous sale abroad
Balance of Trade
- Difference between the value of a countries export and the value of the countries import over a specific period of time
- If import exceeds export, a country has a trade deficit, otherwise surplus
- Balance of trade is affected by factor such as exchange rates, tariffs, and competition of countries industries.
Balance of Payment
Balance of payment is a broader concept that includes balance of trade and also other financial transactions of a country with the rest of the world.
- Current Account: flow of goods, services and income.
- Capital Account: flow of capital including investments, loans.
- Financial Account: change in ownership of financial assets and liabilities. Stocks
Free Trade
- economic policy, which allows unrestricted entry and exit of foreign firms
- benefits, all participating firms
- allows countries to access goods which they cannot produce efficiently
- but can negatively affect domestic producers, prioritizing short-term gains over long-term.
Protectionism
- opposite of free trade, restricted entry and exit of foreign forms
- supports domestic production instead of allowing other countries to sell products at cheaper price
- involves multiple exchange rates, tariffs custom duties regulations
- while it supports young industries, but it can lead to higher prices and potentially harm overall economic growth