Ppe
| Unit | Syllabus |
|---|---|
| 1 | Indian energy scenario, Indian coals: formation, properties, analysis, benefication and heating value calculation of coals; coking and non-coking coals, fuel handling systems; coal gasification. Classification of power plants, base load and Peak load power stations, co-generated power plant, captive power plant, and their fields of application & selection criteria. |
| 2 | Steam Generators: High pressure utility boiler, natural and forced circulation, coking and non-coking coal, coal benefication, coal pulverization, pulverized fuel firing system, combustion process, need of excess air, cyclone furnace, fluidized bed boiler, electrostatic precipitators and wet scrubbers, boiler efficiency calculations, water treatment. |
| 3 | Combined Cycle Power Plants: Binary vapour cycles, coupled cycles, gas turbine- steam turbine power plant, gas pipe line control, MHD-Steam power plant. |
| 4 | Other power plants: Nuclear power plants - working and types of nuclear reactors, boiling water reactor, pressurized water reactor, fast breeder reactor, controls in nuclear power plants, hydro power plant -classification and working of hydroelectric power plants, tidal power plants, diesel and gas power plants. |
| 5 | Instrumentation and Controls in power plants: Important instruments used for temperature, flow, pressure, water/steam conductivity measurement; flue gas analysis, drum level control, combustion control, super heater and re-heater temperature control, furnace safeguard and supervisory system (FSSS), auto turbine run-up system(ATRS). |
| 6 | Environment Pollution and Energy conservation: Economics of power generation: load duration curves, power plant economics, pollution from power plants, disposal/management of nuclear power plant waste, concept of energy conservation and energy auditing. |
UNIT 1
Indian Energy Scenario
- Per capita energy consumption in India is low compared to developed countries (4% of USA, 20% of world average).
- Energy demand expected to increase over next 10-15 years.
- Coal remains dominant fuel for power generation.
Primary Energy Mix (≈ 2023–24)
- Coal: ~55 % (dominant source for electricity)
- Oil & Gas: ~30 % (transport, industry, residential)
- Renewables: ~13 % (solar, wind, small hydro, biomass)
- Nuclear & Hydro: ~2 % each
Key Drivers & Challenges
- Rapid economic growth → rising electricity demand (≈ 6 % / year)
- Energy security → domestic coal + diversified imports
- Emissions & climate goals → shift to renewables, cleaner coal tech
Indian Coals
Coal in India
- India has world's 4th largest coal reserves
- Coal accounts for 55% of country's energy needs
- Gondwana coal makes up 98% of total reserves and 99% of production
- Indigenous coal production needs expansion to meet future demand
Formation & Types
- Origin: Terrestrial plant matter buried in swamps → peat → lignite → sub-bituminous → bituminous → anthracite (highest rank).
- Indian Coal Zones:
- Jharia, Raniganj, Bokaro: High-rank bituminous (coking)
- Talcher, Neyveli: Lignite, sub-bituminous (non-coking)
Beneficiation (Coal Washing)
- Purpose: Remove inert ash and impurities → raise heating value, reduce emissions.
- Methods:
- Gravity Separation: Dense medium cyclone, jigs.
- Froth Flotation: For fine-sized coal.
- Magnetic Separation: Removes iron-bearing gangue.
- Benefits:
- Lower ash → fewer boiler fouling & slagging problems
- Reduced transport cost per unit energy
- Less particulate emissions (fly ash, bottom ash)
Heating Value Calculation
- Gross Calorific Value (GCV):
- Approximate Formula (Dulong’s): Estimate heating value from the elemental composition. (carbon, hydrogen, sulfur, and ash content)
where C, H, O, S are mass % of carbon, hydrogen, oxygen, sulfur.
- Example: Coal with C = 55 %, H = 4 %, O = 20 %, S = 1 %
Coking vs. Non-Coking Coals
| Feature | Coking Coal | Non-Coking Coal |
|---|---|---|
| Rank | Bituminous (high VM and plasticity) | Lower rank (sub-bituminous, lignite) |
| Coke Formation | Softens, swells, resolidifies into solid porous coke on heating | Does not form coherent coke |
| Uses | Steelmaking (blast furnace coke) | Power generation, cement plants |
| Ash Content | Low | High |
| Volatility | Low to medium | High |
| Moister | Low to medium | High |
Coal Gasification
- Process of producing syngas (CO, H2, CO2, CH4).
- Involves blowing coal with oxygen and steam under heat and pressure.
- Used for in-situ gasification and in coal refineries.
- Reactions:
- C + O₂ → CO₂
- C + ½O₂ → CO
- C + H₂O → CO + H₂
- Types of Gasifiers:
- Fixed-Bed Gasifiers: Simple design for coarser fuels.
- Fluidized-Bed Gasifiers: Offer better mixing, suitable for low-grade coal.
- Entrained-Flow Gasifiers: Operate at very high temperatures and are used for fine coal particles.
- Syngas Composition: Mainly consists of CO, H₂, CO₂, and CH₄, which can be used for power generation or chemical synthesis.
- Advantages & Challenges:
- ✔️ Lower SOₓ/NOₓ emissions than direct combustion
- ✔️ Produces a clean, versatile fuel stream
- ❌ High capital cost; tar handling; ash slagging
Coal Fuel Handling System
Purpose: Receive, store, prepare, and deliver fuel (coal, oil, or gas) to the boiler at the correct rate, size, and quality.
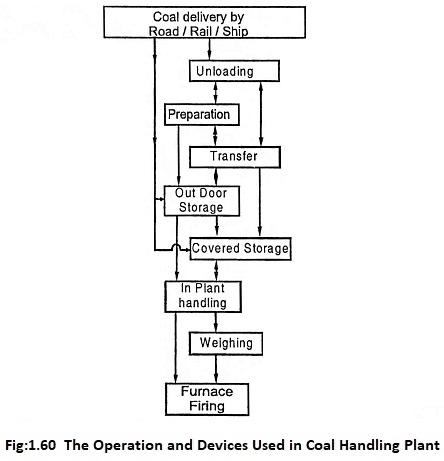

- Unloading
- Rail Wagons: Rotary car dumpers or bottom-discharge tipplers.
- Trucks/Ships: Hopper tipplers or grab cranes for maritime imports.
- Transfer & Conveyance
- Belt Conveyors: Main arteries carrying coal to stacking or crushing areas.
- Apron & Chain Conveyors: Heavy-duty for large lumps.
- Screw Conveyors: Short shifts into crushers or feeders.
- Stacking & Storage
- Stacker‐Reclaimers: Radial or bridge-type machines to build coal stockpiles and reclaim them as needed.
- Stockyard: Open pile or covered dome; capacity sized for plant autonomy (days–weeks of fuel).
- Crushing & Screening
- Primary Crusher (Jaw/Hammer): Reduces large lumps (>300 mm) to 50–100 mm.
- Secondary Crusher (Roll/Cone): Further refines to boiler feed size (10–20 mm).
- Screens & Classifiers: Remove oversize & tramp metal.
- Bunkering & Feeding
- Coal Bunker/Hoppers: Buffers immediately upstream of mills or feeders.
- Coal Feeders (Vibratory/Reciprocating or Screw): Meter coal into mills or directly into the furnace.
- Dust Suppression & Safety
- Water Sprays / Fogging Systems: Minimize fugitive dust at transfer points.
- Dust Collectors (Bag Filters): Capture airborne fines in enclosed conveyors.
- Fire Detection & Inerting: Early-warning sensors and inert-gas blanketing in silos.
Types of Coal Conveyors
- Belt Conveyors
- Description: Continuous loops of rubberized fabric or steel-cord belt carried on rollers.
- Use: Bulk transport over long distances and inclines (up to 20°–25°).
- Pros: High capacity, flexible routing, relatively low capital cost.
- Variants:
- Troughed Belt: Edges are angled up (for loose bulk).
- Flat Belt: For unit loads or boxes.
- Cleated Belt: Vertical flights for steep inclines.
- Apron (Pan) Conveyors
- Description: Series of overlapping steel pans or plates mounted on chains.
- Use: Heavy, hot, abrasive, or sharp-edged coal; also in reclaimers.
- Pros: Robust, resistant to impact and heat; can handle large lump sizes.
- Cons: Higher capital & maintenance cost; lower speed.
- Chain Conveyors
- Description: Single or double strand of heavy-duty chain on sprockets, with carriers or flights.
- Use: Short-distance horizontal transport in bunkers or hoppers.
- Pros: Simple, compact, good for severe conditions.
- Cons: Limited length; noise and wear.
- Bucket Elevators
- Description: Series of buckets fixed to a vertical belt or chain.
- Use: Vertical lifting of coal from lower to higher levels.
- Pros: Small footprint, enclosed (dust-tight).
- Cons: Limited capacity; risk of spillage if overloaded.
- Screw (Auger) Conveyors
- Description: Helical screw blade (flighting) rotating inside a tubular or U-shaped trough.
- Use: Short, low-capacity conveying, feeding crushers or bunkers.
- Pros: Enclosed system (dust control), simple.
- Cons: Not suitable for large lumps; high power consumption per tonne.
- Pneumatic Conveyors
- Description: Coal particles suspended in an air stream through pipes.
- Use: Fine, crushed coal dust transport in confined layouts.
- Pros: No moving mechanical parts along the run; clean, enclosed.
- Cons: High energy use; extensive filtration needed.
Ash Handling System
Purpose: Collect, transport, and dispose of ash produced by coal combustion—both bottom ash (clinker) and fly ash.
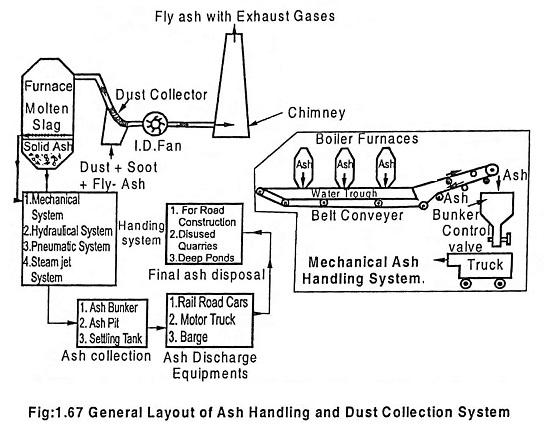
Types of Ash
| Ash Type | Origin | Particle Size |
|---|---|---|
| Bottom Ash | Coarser residues falling to furnace hearth | ~10 – 50 mm |
| Fly Ash | Fine particles carried with flue gas | < 100 μm |
| Economizer Ash | Very fine particles from heat exchangers | < 5 μm |
Bottom Ash Handling
- Grate/Boiler Hopper
- Collects the heavy particles under the furnace.
- Ash Crushers / Breakers
- Reduce clinkers to manageable size for conveying.
- Hydraulic (Wet) System
- Water-Cooled Conveyor Belt: Bottom ash quenched with water → sluiced into a water-filled sump.
- Dewatering Screen/Classifier: Separates water, discharges semi-dry ash to silo.
- Mechanical (Dry) System
- Belt or Screw Conveyor: Directly transports cooled ash.
- Air-Cooled Hopper & Conveyor: Minimizes water use; ash remains dry.
Fly Ash Handling
- Electrostatic Precipitator (ESP) / Baghouse
- Captures > 99 % of fly ash from flue gas.
- Fly Ash Silo / Hopper
- Intermittent storage under the ESP outlets.
- Pneumatic Conveying
- Dense-Phase (Plug Flow): Low velocity, high pressure → less pipe wear.
- Lean-Phase (Dilute Flow): High velocity, lower pressure → simpler but more abrasion.
- Ash Sluicing (Wet)
- Hydraulic Ash Transport: Mix ash with water (30–40 % solids) → slurry pumped to ash pond or dewatering plant.
Disposal & Utilization
- Ash Ponds / Dams: Impoundment of slurry; risk of seepage and environmental impact.
- Dry Ash Landfill: Requires engineered liners; preferred for fly ash reuse.
- Beneficiation & Utilization:
- Cement & Concrete: Fly ash as pozzolanic material.
- Bricks & Blocks: Bottom ash aggregates.
- Road Construction: Sub-base material.
Difficulties in Ash Handling
- High Temperature & Abrasion
- Hot bottom ash (>550 °C) wears equipment; fine fly ash erodes pipes and valves.
- Slurry Management
- Balancing ash–water slurry density to avoid blockages and high pumping costs.
- Dust Emissions
- Fugitive PM₂.₅/PM₁₀ at transfer points requires enclosed conveyors or bag filters.
- Corrosion
- Wet ash leachates (sulfates/chlorides) corrode pumps, pipes, and linings.
- Pond Stability & Land Use
- Ash pond siltation, dam integrity monitoring, and land consumption for storage.
- Variable Ash Quality
- Fluctuating ash composition (carbon/chemistry) clogs hoppers and complicates reuse.
- Regulatory Compliance
- Controlling leachate, meeting PM and water-quality standards drives costs.
Classification of Power Plants
- By Energy Source
- Thermal (coal, gas, diesel, oil)
- Hydro (run-of-river, reservoir, pumped‐storage)
- Nuclear (PWR, BWR, FBR…)
- Renewables (wind, solar PV, biomass, geothermal, tidal)
- By Load Service
- Base‐Load Plants: Run continuously to meet the “always-on” demand.
- Peak‐Load Plants: Used only during periods of highest demand.
- Load‐Following Plants: Can ramp output up/down to track daily demand fluctuations.
- By Location & Ownership
- Utility-Owned Central Stations (grid‐scale)
- Captive Power Plants (on-site for industrial/self-use)
- Co-Generation/CHP Plants (produce power + useful heat)
- By Operation Mode
- Continuous Operation: High availability, high capacity factor
- Intermittent Operation: Starts/stops according to demand or resource availability
Base-Load vs. Peak-Load Power Stations
- Base Load Power Stations:
- Operation: Run continuously (24/7) to supply the constant minimum demand.
- Examples: Coal-fired, nuclear, large hydroelectric.
- Selection Criteria: High efficiency at full load, lower operational cost, long-term stability.
- Peak Load Power Stations:
- Operation: Activated during high demand periods; may run intermittently.
- Examples: Gas turbines, diesel engines, open cycle gas turbines.
- Selection Criteria: Quick start-up, flexible operation, higher efficiency during peak hours, lower capital cost relative to intermittent use.
| Feature | Base-Load Stations | Peak-Load Stations |
|---|---|---|
| Typical Technologies | Coal, nuclear, large hydro, CCGT (combined-cycle gas turbines) | Open-cycle gas turbines, diesel gensets |
| Capacity Factor | High (70–90 %) | Low (5–20 %) |
| Startup Time | Slow (hours to days; e.g. nuclear 8–24 h) | Fast (seconds to minutes) |
| Efficiency | High (35–60 %) | Lower (25–40 %) |
| Fuel Cost Sensitivity | Less sensitive (long-term contracts) | Very sensitive (spot fuel pricing) |
| Capital Cost | High | Low to moderate |
| Purpose | Provide the “minimum” continuous demand | Meet short‐duration “peaks” |
Co-Generation (Combined Heat & Power, CHP)
- Definition: Simultaneous production of electricity and useful thermal energy (steam, hot water) from a single fuel source.
- Configurations:
- Topping Cycle: Power generation first; waste heat recovered for process or heating. (Primary)
- Bottoming Cycle: Industrial process produces high‐temperature exhaust; used to run a steam turbine. (Secondary)
- Key Benefits:
- Fuel Efficiency: Overall energy utilization up to 80–90 % (vs. ~35–50 % for separate heat + power).
- Reduced Emissions: Lower CO₂ and pollutants per unit of useful energy.
- Cost Savings: Displaced fuel and grid electricity purchases.
- Fields of Application:
- Industrial: Refineries, paper mills, chemical plants, food processing.
- Commercial: District heating, hospitals, campuses.
- Commercial Buildings: Combined heat and cooling with absorption chillers.
- Selection Criteria:
- Heat Demand Profile: Must have steady thermal load to justify recovery.
- Fuel Availability & Cost: Natural gas pipelines or captive fuel supplies.
- Space & Integration: Physical layout to accommodate turbine, heat exchangers.
- Economic Payback: Capital cost vs. savings on heat and power.
Captive Power Plants
- Definition: Plant owned and operated by an industrial or commercial entity to supply its own energy needs, either on‐site or nearby.
- Advantages:
- Reliability: Dedicated supply; avoids grid outages.
- Cost Control: Avoids transmission/transformation charges; possible fuel cost advantages.
- Customization: Sized and configured to match process load profile.
- Typical Technologies: Diesel or gas‐turbine gensets, small thermal boilers with steam turbines, biomass gasifiers.
- Fields of Application:
- Heavy Industry: Steel mills, cement plants, fertilizer complexes.
- Remote Locations: Mines, plantations, island communities.
- High‐Reliability Needs: Data centers, hospitals.
- Selection Criteria:
- Load Profile & Capacity Factor: Match plant size to average and peak demands.
- Fuel Logistics: Proximity to coal, gas pipelines, or fuel storage.
- Regulatory Environment: Permissions, emissions standards for captive generation.
- Return on Investment: Compare cost per kWh vs. buying from grid.
Selection Criteria Across Plant Types
- Economic Factors:
- Capital investment vs. operational cost.
- Payback period and return on investment.
- Technical Factors:
- Plant efficiency and reliability.
- Flexibility in ramping up or down.
- Compatibility with available fuel types.
- Environmental and Regulatory Factors:
- Emission norms and pollution control.
- Regulatory approvals and environmental impact assessments.
- Operational Factors:
- Load demand profile (base, intermediate, or peak).
- Proximity to consumption points.
- Fuel supply stability and infrastructure availability.
| Criterion | Base-Load | Peak-Load | Co-Generation | Captive |
|---|---|---|---|---|
| Load Factor | High | Low | Medium–High | Depends on site |
| Flexibility | Low | High | Medium | Medium |
| Capital Cost/kW | High | Low–Medium | High | Varies |
| Fuel Cost Sensitivity | Medium | High | High | High |
| Efficiency | High | Low–Medium | Very High | Varies |
| Start-Up Time | Slow | Fast | Moderate | Moderate–Fast |
| Applications | Grid support | Peak shaving | Process industries, district energy | Industrial/self-use |
UNIT 2 (Rough)
High-Pressure Utility Boilers
- Definition Boilers designed to generate steam at pressures > 100 bar and temperatures up to ~600 °C for large power stations.
- Key Features
- Drumless (Once-Through) Design: Water flows through a series of economizer, evaporator, superheater tubes only once—no steam drum.
- Tube Materials: Alloy steels (e.g., T91, P92) to withstand high temperatures and pressures.
- Furnace Construction: Water-wall tubes form furnace walls, absorbing radiant heat directly.
- Control Systems: Online water-wall temperature and steam-quality monitoring; feed-water flow and fuel flow interlocks.
- Advantages
- Compact, lighter pressure parts.
- Fast start-up (no need to fill/steam drums).
- High efficiency at elevated parameters.
Natural vs. Forced Circulation
| Feature | Natural Circulation | Forced Circulation |
|---|---|---|
| Driving Force | Density difference between hot & cold water columns | Pump delivers water through tubes |
| Circulation Pump | None | One or more pump units |
| Flow Rate Control | Passive—depends on heat input and loop geometry | Active—pump speed or flow control valve |
| Application | Low- to medium-pressure boilers (< 100 bar) | High-pressure, once-through boilers |
| Advantages | Simple, no pump power needed | Precise flow control, smaller tube diameters |
| Drawbacks | Requires large riser/downcomer loops | Pump adds parasitic load, complexity |
Pulverized Fuel Firing System
- Coal Pulverizer (Mill)
- Types: Bowl mill, ball tube mill, vertical spindle mill
- Function: Grind raw coal to < 75 µm (70–75 % passing 200 mesh)
- Primary Air System
- Supplies drying and conveying air (extracted from boiler FD fan).
- Separator
- Classifies fine from coarse particles; rejects coarse back to mill.
- Coal Pipe Network & Nozzles
- Enclosed steel pipes transport coal–air mixture to burners; burner nozzles designed for optimal spray pattern and mixing.
- Burners
- Swirl/Corner Burners: Promote rapid mixing and flame stabilization.
- Seals & Reheating: Prevent flashback and maintain ignition.
Combustion Process & Need for Excess Air
- Stoichiometric Combustion: Exact O₂ to burn all fuel carbon to CO₂ and hydrogen to H₂O.
- Excess Air (EA):
- Supplies extra oxygen to ensure complete combustion.
- Typical EA: 20–30 % for pulverized-coal boilers.
- Reasons for EA:
- Fuel Heterogeneity: uneven particle size and moisture.
- Mixing Limitations: imperfect air–fuel contact.
- Flame Stability: lean mixture zones risk CO/soot formation.
- Drawbacks of Too Much EA:
- Heat carried away by surplus N₂ and unused O₂ → lower boiler efficiency.
- Increased fan power consumption.
Cyclone Furnace
- Design:
- Tangentially fired refractory-lined cylindrical chamber.
- Coal ash clinks and slag melts on hot walls; particles swirl.
- Operation:
- Pea-sized coal fed into cyclone with primary air.
- Swirl generates > 1,200 °C to melt ash into slag.
- Slag falls into water-cooled screw conveyor for removal.
- Gases exit tangentially to boiler furnace.
- Advantages:
- Can burn low-grade, high-ash fuels.
- Low unburned carbon in ash (%).
- Drawbacks:
- Slag handling complexity.
- Higher refractory and maintenance cost.
Fluidized Bed Boiler
- Principle: Fine coal or solid fuel particles suspended (“fluidized”) in upward airflow at 3–10 m/s → behaves like boiling liquid.
- Types:
- Bubbling Fluidized Bed (BFB): Lower velocity; distinct bubbles.
- Circulating Fluidized Bed (CFB): Higher velocity; particles entrained and returned via cyclone.
- Benefits:
- Uniform temperature (~850 °C) → low NOₓ formation.
- In-bed sorbent (limestone) injection captures SO₂.
- Can burn varied, low-grade fuels (biomass, waste).
- Challenges:
- Erosion of tubes by high-velocity particles.
- Complex solids circulation control.
Electrostatic Precipitators (ESP) and Wet Scrubbers
A. Electrostatic Precipitator
- Function: Remove fly ash from flue gas by ionizing particles and collecting them on charged plates.
- Components:
- Electric Field Sections: High-voltage electrodes create corona.
- Collecting Plates: Oppositely charged to attract particles.
- Rapping Mechanism: Periodic vibration knocks ash into hopper.
- Efficiency: > 99 % for PM > 1 µm.
B. Wet Scrubber
- Function: Use liquid sprays (usually water) to “wash” pollutants (SO₂, particulates) from flue gas.
- Types:
- Spray Tower: Gas flows upward against downward sprays.
- Venturi Scrubber: Gas accelerated through throat → droplets capture particles via impaction.
- Applications:
- SO₂ removal with alkaline slurry (limestone/lime).
- Fine particulate removal.
Boiler Efficiency Calculations
- Direct (Input–Output) Method:
- Indirect (Heat Loss) Method:
- Losses Include: Dry flue gas, moisture in fuel, moisture formed, radiation & convection, unburned carbon in ash, blowdown.
- Typical Efficiency: 85–92 % for modern utility boilers.
Boiler Feed-Water Treatment
- Objectives:
- Remove hardness ions (Ca²⁺, Mg²⁺) to prevent scale.
- Control pH and oxygen to minimize corrosion.
- Processes:
- Demineralization (Ion Exchange): Softening and de-ionization to < 0.1 µS/cm conductivity.
- Condensate Polishing: On-line mixed-bed filters to capture trace impurities.
- Chemical Treatment:
- Oxygen Scavengers: Hydrazine or sulfite to remove dissolved O₂.
- pH Adjusters: Amine dosing (morpholine, cyclohexylamine) for neutralizing amines.
- Phosphate Treatment: To precipitate hardness in drum boilers.
- Monitoring: Continuous conductivity, silica, and dissolved oxygen analyzers.
UNIT 3 (Rough)
Binary Vapor Cycles
- Definition: Two‐stage Rankine cycle using two different working fluids, each optimized for a part of the heat‐source temperature range.
- Operation:
- High‐Temperature Loop: Fluid A (e.g. ammonia) vaporizes at high source temperature → drives a turbine → rejects heat at intermediate temperature.
- Low‐Temperature Loop: Fluid B (e.g. water/steam) picks up that rejected heat → vaporizes → drives a second turbine → rejects to condenser.
- Advantages:
- Better utilization of a wide temperature gradient.
- Higher overall thermal efficiency than a single‐fluid cycle when heat source spans (>150 °C) to (<60 °C).
- Applications: Geothermal power where reservoir temperature is moderate (~150–200 °C).
Coupled (Cascade) Cycles
- Definition: Two or more simple cycles arranged so that the waste heat of the “upper” cycle becomes the heat input to the “lower” cycle.
- Types:
- Steam–Organic Cascade: High‐pressure steam cycle feeding an Organic Rankine Cycle (ORC).
- Gas Turbine–Steam Turbine (Combined Cycle): See next section.
- Key Point: Each cycle operates near its optimal temperature range, maximizing total work output.
Gas Turbine–Steam Turbine Power Plant (Combined Cycle)
- Configuration:
- Brayton (Gas Turbine) Cycle:
- Air Compression → Combustion → Turbine expansion → Exhaust (~500 °C).
- Heat Recovery Steam Generator (HRSG):
- Uses turbine exhaust to boil water.
- Rankine (Steam Turbine) Cycle:
- Steam expands through high/intermediate/low‐pressure turbines → condenser.
- Brayton (Gas Turbine) Cycle:
- Thermal Efficiency: 55–62 % (vs. 35–40 % for simple gas or steam alone).
- Advantages:
- Rapid start (gas turbine) plus high efficiency.
- Lower CO₂ per kWh than coal plants.
- Typical Layout: Single-shaft or multi-shaft arrangement depending on capacity/flexibility requirements.
Gas Pipeline Control
- Purpose: Safely transport natural gas over long distances at high pressure (30–80 bar).
- Key Control Functions:
- Pressure Regulation:
- Inlet Stations: Compressors boost pressure to overcome frictional drop.
- Pressure-Reducing Stations: Downstream stations throttle or use control valves to maintain delivery pressure.
- Flow Measurement & Control:
- Orifice Meters and Ultrasonic Flow Meters track volume.
- Control Valves adjust for contractual delivery rates.
- Safety Systems:
- Emergency Shutdown Valves (ESDVs): Close on leak detection or overpressure.
- SCADA Integration: Remote monitoring of pressure, flow, temperature.
- Pigging Operations:
- Pipeline Inspection Gauges (PIGs): Clean, inspect, and separate liquids to maintain flow efficiency.
- Pressure Regulation:
- Challenges: Maintaining tight control in long pipelines to minimize leaks, pressure transients (“water hammer”–like effects), and ensure compressor reliability.
MHD–Steam Power Plant
- Magneto-Hydro-Dynamic (MHD) Cycle:
- Working Fluid: Ionized combustion gas (e.g., coal combustion products seeded with potassium carbonate).
- Process:
- Combustion Chamber: Fuel + oxygen → gas at ~2,500 K.
- MHD Generator: Hot ionized gas passes through a strong magnetic field → induces electricity directly (no moving parts).
- Seed Recovery & Gas Cleanup: Recover seed material and remove particulates.
- Heat Recovery Steam Generator (HRSG): Remaining heat → steam turbine cycle.
- Total Efficiency: Potentially > 50 % due to direct conversion in the MHD stage and subsequent steam cycle.
- Advantages:
- High‐temperature conversion bypasses the Carnot limit of mechanical turbines.
- Drawbacks:
- Requires very high temperatures and robust materials.
- Seeding and cleanup systems are complex and costly.
- Status: Largely experimental; no large‐scale commercial MHD plants in operation.
UNIT 4
Nuclear Power Plant and Types
- Fission Reaction
- A neutron hits a uranium‑235 nucleus → it splits into two smaller nuclei + 2–3 neutrons + ~200 MeV of heat.
- Those extra neutrons go on to split more nuclei (chain reaction), as long as enough fuel and neutrons remain.
- Key Components & Flow
- Fuel Rods: Ceramic UO₂ pellets in long metal tubes (“fuel assemblies”).
- Moderator: Usually light water; slows neutrons so fission stays efficient.
- Control Rods: Made of boron or cadmium; inserted to soak up neutrons (slows/stops fission).
- Coolant Loop: Hot water (or liquid sodium) circulates through the core, picks up heat, and carries it away.
- Steam Side (PWR vs BWR):
- PWR: Coolant stays liquid under ~155 bar. It flows through a steam generator to boil water in a separate loop → steam spins the turbine.
- BWR: Coolant boils right inside the reactor vessel at ~70 bar. That steam, after moisture separation, goes straight to the turbine.
- Containment Building: Thick concrete/steel “shell” around the reactor vessel to trap any radioactive leaks.
- Safety & Shutdown
- Scram (Emergency Shutdown): All control rods slam in within seconds.
- Emergency Core Cooling: Backup pumps or gravity‑fed water flood the core if pressure or flow drops.
- Containment Spray: Cools and filters any gases before venting.
1. Pressurized Water Reactor (PWR)
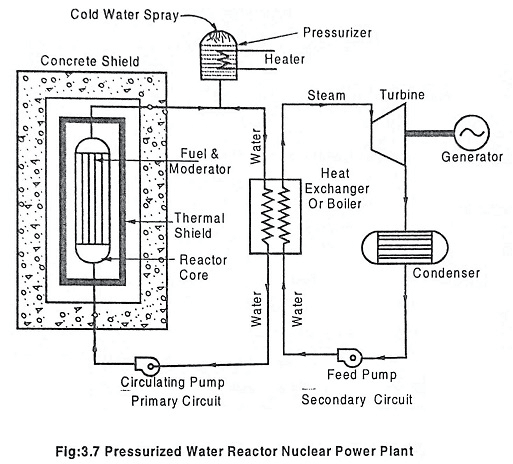
- Coolant & Moderator
- Light water (H₂O) under high pressure (~15–16 MPa)
- Water acts both as coolant and neutron moderator
- Core & Steam Generation
- Primary loop: water heated in core (≈300 °C), kept liquid by high pressure
- Heat transferred via a steam generator → secondary loop produces steam
- Fuel
- Low-enriched uranium dioxide (UO₂), typical enrichment 3–5 % U-235
- Control
- Control rods inserted into core; boron dissolved in primary water for reactivity control
- Pros
- Mature technology; large operational fleet worldwide
- Leaks in primary loop contain radioactivity
- Cons
- Requires large, thick-walled pressure vessels
- Thermal efficiency ≈ 33–34 %
2. Boiling Water Reactor (BWR)
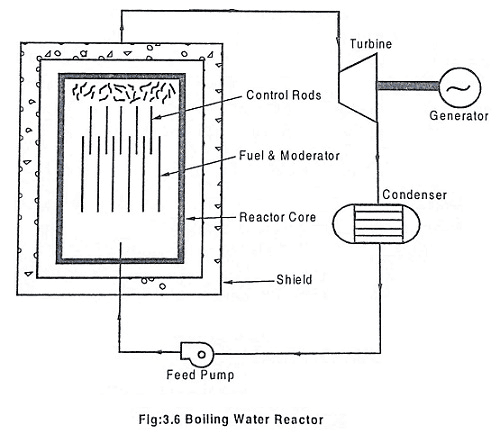
- Coolant & Moderator
- Light water (H₂O) at lower pressure (~7–8 MPa)
- Water acts as both coolant and moderator
- Core & Steam Generation
- Water boils directly in the reactor vessel → saturated steam goes to turbine
- No separate steam generator or secondary loop
- Fuel
- Low-enriched UO₂, similar enrichment to PWR
- Control
- Control rods inserted from bottom; fine reactivity control via recirculation flow
- Pros
- Simpler design: fewer components (no steam generator)
- Slightly higher thermal efficiency (≈ 34–35 %)
- Cons
- Turbine hall components become more radioactive (direct cycle)
- Requires more shielding around turbine
3. Fast Breeder Reactor (FBR)
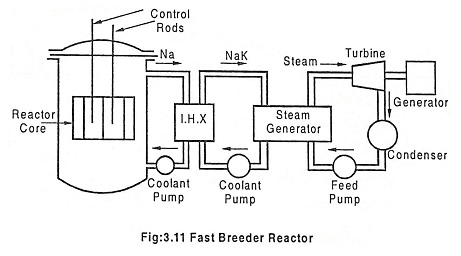
- Coolant & Moderator
- No moderator (fast neutrons)
- Liquid metal coolant, typically sodium (Na) at atmospheric pressure
- Core & Breeding
- Fast neutrons convert fertile U-238 into Pu-239 (“breed” fuel)
- Breeding ratio > 1 (more fissile produced than consumed)
- Fuel
- Mixed oxide (MOX) of PuO₂ + UO₂, or metal alloy fuels
- Control
- Control rods and sometimes a “blanket” of fertile material
- Pros
- Efficient use of uranium (× 50–100 more energy per kg)
- Can consume actinides, reducing long-term waste radio-toxicity
- Cons
- Sodium is chemically reactive (air/water) → safety/maintenance challenges
- Higher capital cost; fewer prototypes in operation
| Feature | PWR | BWR | FBR |
|---|---|---|---|
| Neutron Spectrum | Thermal | Thermal | Fast |
| Coolant | Pressurized H₂O | Boiling H₂O | Liquid sodium |
| Steam Loop | Two-loop | Single-loop | Two-loop (Na–water) |
| Moderator | H₂O | H₂O | None |
| Fuel | Low-enriched UO₂ | Low-enriched UO₂ | Pu/U MOX or metal alloys |
| Thermal Eff. | ≈ 33–34 % | ≈ 34–35 % | ≈ 40 % (higher core temp) |
| Breeding | No | No | Yes (breeding ratio > 1) |
| Main Drawback | Heavy pressure vessel | Radioactive steam circuit | Sodium handling & cost |
Control in Nuclear Power Plants
A. Principles of Reactivity Control
- Reactivity: measure of how far the chain reaction is from being self-sustaining (k = 1).
- Goal: keep k ≈ 1 for steady power; adjust when starting, stopping, or changing load.
B. Main Control Mechanisms
| Method | Description |
|---|---|
| Control Rods | Neutron-absorbing rods (Boron carbide, Ag–In–Cd alloys) inserted/withdrawn to “soak up” excess neutrons. Fast response; primary shutdown device. |
| Chemical Shim (Boron) | Soluble boric acid in PWR primary coolant. Vary concentration to fine-tune long-term reactivity. |
| Moderator Temperature | In PWRs/BWRs: hotter moderator = lower density = fewer slow neutrons = negative feedback (“temp. coefficient”). Helps stabilize power. |
| Coolant Flow Rate | In BWRs: changing flow alters void fraction (steam bubbles) and thus neutron moderation; used for load following. |
| Burnable Poisons | Materials (e.g. gadolinium) in fuel assemblies that absorb excess neutrons early in life, then “burn away” to flatten reactivity over cycle. |
C. Safety & Protection Systems
- Reactor Protection System (RPS)
- Hardwired logic that scrams (fully inserts rods) if parameters exceed safe limits (e.g. high power, pressure, temperature).
- Emergency Core Cooling System (ECCS)
- Injects high-pressure water or alternative coolant if a loss-of-coolant accident (LOCA) is detected.
- Automatic Control & Instrumentation
- Digital/analog controls manage rod positions, boron addition, flow control, and trip logic.
- Xenon Poisoning Management
- Xenon-135 builds up after power changes, absorbing neutrons. Operators plan maneuvers (and boron adjustments) to avoid “iodine pit” transients.
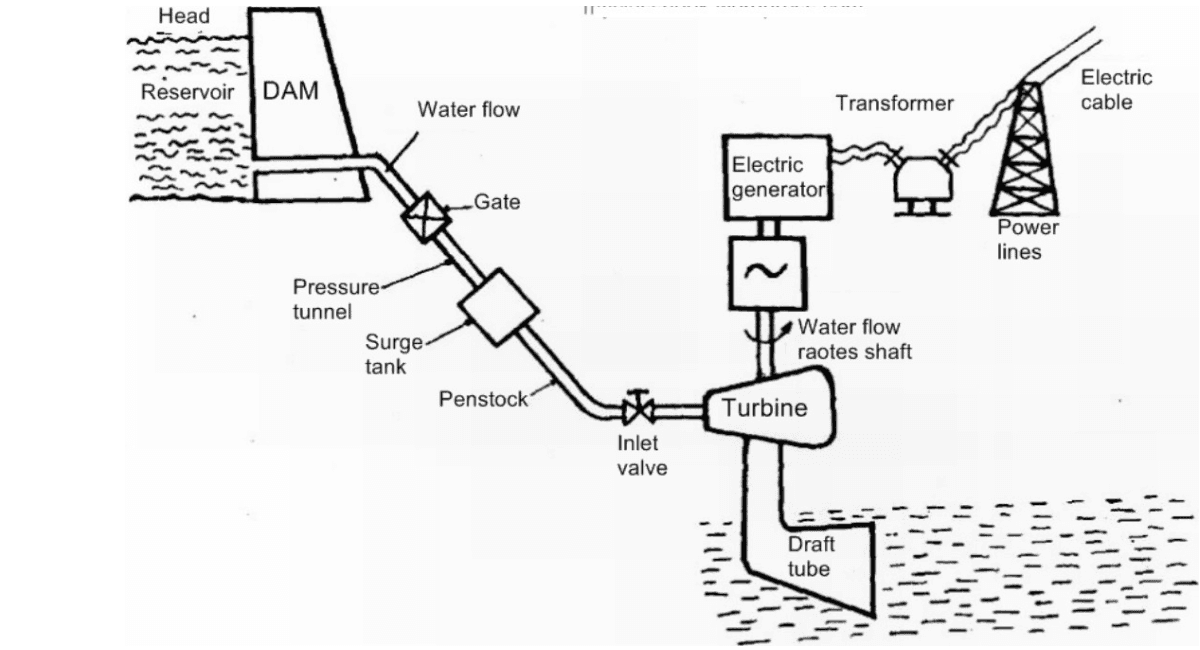
Hydroelectric Power Plant
1. Basics of Hydroelectric Power
Principle:
Convert the potential and kinetic energy of water into electricity via turbines and generators.
Key Components:
- Dam or Intake Structure
- Creates a head (height difference) or diverts flow.
- Reservoir (for storage plants)
- Stores water; smooths out seasonality.
- Penstock
- Closed pipe conveying water from intake to turbine.
- Turbine
- Water’s energy spins runner blades (types vary by head & flow).
- Generator
- Coupled to the turbine shaft; produces AC power.
- Tailrace
- Discharges water back to the river downstream.
- Control Gates & Valves
- Regulate flow and protect equipment.
- Switchyard / Transformer
- Steps up voltage for transmission.
2. Classification by Plant Layout
- Storage (Reservoir): Big dam creates lake; release water on demand. High capital cost.
- Run‑of‑River: Little storage—power follows river flow hour‑to‑hour. Variable output.
- Pumped‑Storage: Two reservoirs at different elevations—pump up at night, generate in day. Responsive to load changes but low efficiency.
3. Classification by Hydraulic Head
Hydraulic head = the vertical drop (m) between intake and turbine.
| Head Category | Head Range | Typical Turbine(s) | Notes |
|---|---|---|---|
| High Head | > 300 m | Pelton wheel | • Impulse turbine<br>• Ideal for steep mountainous sites where you can get a lot of drop over a short distance. |
| Medium Head | 30–300 m | Francis turbine | • Reaction/mixed-flow turbine<br>• Very versatile—most common in large conventional plants. |
| Low Head | < 30 m | Kaplan or Propeller | • Axial-flow reaction turbines<br>• Suited to large flow rates but small elevation changes (e.g., low-lying rivers).<br>• Adjustable blades; hence loads. |
4. Plant Operation & Control
- Flow Regulation
- Guide vanes or wicket gates adjust flow rate.
- Speed Control
- Governor maintains generator speed (50/60 Hz).
- Load Balancing
- Run-of-river adjusts to available flow.
- Reservoir and pumped storage can follow load curves.
- Safety Systems
- Surge tanks relieve water hammer.
- Relief valves protect penstock integrity.
5. Advantages & Disadvantages
| Advantages | Disadvantages |
|---|---|
| • Renewable, low operating cost | • High upfront investment |
| • Very long plant life (50–100 years) | • Environmental impacts (habitat, fish migration) |
| • Low greenhouse‐gas emissions | • Siltation risk in reservoirs |
| • Fast startup and grid support | • Site‐specific (depends on topography) |
6. Power Formula:
• η = overall efficiency (85–95 %), • ρ = water density (1 000 kg/m³), • g = 9.81 m/s², • Q = flow rate (m³/s), • H = net head (m).
Tidal Power Plant
Tidal power harnesses the energy from natural rise and fall of ocean tides to generate electricity. It’s highly predictable (governed by moon and sun) and environmentally clean once built.
1. Working Principle
- Tidal Range (Head): Difference in water level between high tide and low tide.
- Flow of Water: As tide rises and falls, water is allowed to flow through turbines.
- Energy Conversion: Kinetic or potential energy of moving water spins turbines, which drive generators to produce AC power.
2. Main Types
| Type | Key Feature |
|---|---|
| Tidal Barrage | Dam-like structure (barrage) across an estuary. Turbines operate on both incoming and outgoing tides. |
| Tidal Lagoon | Enclosed “ring” of sea walls built into a bay or coastline. Functions like a mini-barrage. |
| Tidal Stream | Underwater horizontal-axis turbines placed directly in strong tidal currents (no dam). |
| Dynamic Tidal Power | Straight dam ("T-shape") extending from coast; exploits phase differences along its length. |
| Tidal Kite / AUV | Underwater “kite” or glider tethered to seabed; moves in a figure-8 to capture energy. |
3. Operation Modes
- Ebb Generation: Water stored at high tide, then released through turbines as tide falls.
- Flood Generation: Turbines turn as sea flows in at rising tide.
- Two-Way Generation: Uses both ebb and flood, doubling energy yield (requires reversible turbines).
- Pumped Enhancement: Some lagoons pump water back at low tide, increasing head for the next cycle (similar to pumped-storage).
Energy per Cycle:
• A = basin area, • R = tidal range (m).
Gas Power Plants
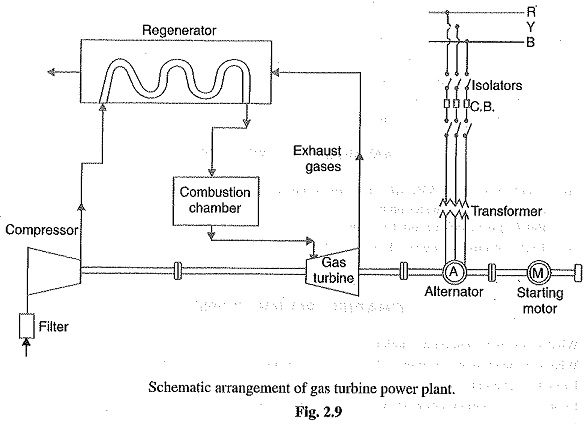
A. Working Principle
- Thermodynamic Cycle: Brayton (open‐cycle) – air is compressed, mixed with fuel, combusted, and the hot gases expand through a turbine to drive a generator.
B. Main Components
- Air Compressor
- Multi‐stage axial or centrifugal; raises air pressure (10–30 bar typical).
- Combustion Chamber
- Fuel (natural gas, LPG, or liquid fuel) injected and burned at constant pressure.
- Turbine
- Hot gas expands through stages (drives compressor on same shaft plus generator).
- Generator
- Synchronous alternator coupled to turbine shaft.
- Exhaust Stack
- Releases spent gas; in CCGT, feeds a Heat Recovery Steam Generator instead.
- Control & Safety Systems
- Fuel and air flow regulation, temperature monitoring, surge protection in compressor.
C. Configurations
| Type | Description |
|---|---|
| Simple Cycle GT | Direct open‐cycle; fast start‐up (~10 min), lower thermal efficiency (30–35 %). |
| Combined Cycle (CCGT) | Gas turbine plus HRSG + steam turbine; thermal efficiency ≈ 55–62 % due to recovery of waste heat. |
| Cogeneration (CHP) | Combined heat and power: extracts steam or hot water for industrial/heating use before condenser. |
| Aero‐Derivative GT | Derived from aircraft engines; very fast start, flexible operation, lower capacity (10–100 MW). |
| Heavy‐Duty GT | Industrial frames; higher capacity (100–400 MW), designed for continuous or cycling service. |
D. Advantages & Disadvantages
| Advantages | Disadvantages |
|---|---|
| • Rapid start & good load‐following | • Lower efficiency if run in simple‐cycle mode |
| • Low capital cost per MW vs. steam plants | • High NOₓ emissions (requires DLN or SCR) |
| • Small footprint; modular | • Performance sensitive to ambient temperature |
| • Scalable (10–400 MW units) | • Combined cycle adds complexity & cost |
Diesel Power Plants
A. Working Principle
Internal Combustion Cycle: Typically 4‐stroke diesel engine; air is compressed, fuel injected, ignites by compression, driving pistons that turn a generator.
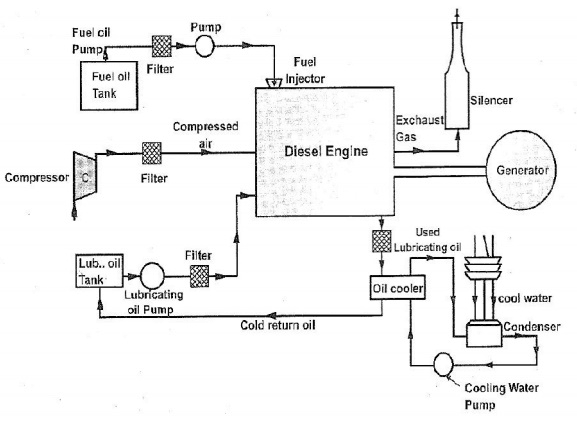
B. Main Components
- Diesel Engine
- 4-stroke compression-ignition unit converting fuel into mechanical crankshaft power.
- Fuel System
- Tank, pump, filters & injectors delivering metered diesel to the engine.
- Air Intake & Exhaust
- Filtered air boosted by turbocharger (if fitted); exhaust routed through silencer.
- Cooling & Lubrication
- Radiator, coolant pump & thermostat regulate temperature; oil pump and filter protect moving parts.
- Governor & Controls
- Mechanical/electronic governor maintains speed; control panel handles start/stop and alarms.
- Generator (Alternator)
- Synchronous machine driven by the engine converts rotation into 3-phase AC power.
- Switchgear & Synchronization
- Circuit breakers and relays manage safe connection/disconnection and paralleling to loads or grid.
C. Configurations & Use Cases
| Type | Application |
|---|---|
| Standby/Backup | Auto‐starts on grid failure; hospital, telecom, data centers. |
| Prime Power | Off‐grid continuous operation; remote communities. |
| Peak‐Shaving | Supplements grid during high demand. |
| Portable Units | Construction sites, events. |
D. Advantages & Disadvantages
| Advantages | Disadvantages |
|---|---|
| • Very fast start‐up & high reliability | • High fuel cost per kWh |
| • Simple installation; compact footprint | • Significant NOₓ, PM and CO₂ emissions |
| • Suitable for remote or emergency use | • Noisy and vibration‐intensive |
| • Modular & easily scaled | • Limited by diesel availability and logistics |
Open-Cycle vs. Closed-Cycle Power Plants
A. Definitions
Open-Cycle
- Process: Working fluid (air, fuel, combustion gases) passes once through the system and is then exhausted (e.g. traditional gas turbines, diesel engines).
- Example Plants:
- Simple-cycle gas turbine
- Diesel‐engine generator
Closed-Cycle
- Process: A sealed working fluid (e.g. helium, CO₂, steam, organic fluids) is continuously circulated in a loop between heat‐addition, expansion (turbine), heat rejection, and compression stages.
- Example Plants:
- Closed-cycle gas turbine (using inert gas)
- Organic Rankine Cycle (ORC) engines
- Closed-steam Rankine loops in nuclear or solar thermal plants
B. Key Differences
| Aspect | Open-Cycle | Closed-Cycle |
|---|---|---|
| Working Fluid | Fresh intake each cycle; exhaust is vented | Same fluid recirculates; isolated from atmosphere |
| Thermal Efficiency | Limited by single expansion → ~30–40 % (simple Brayton) | Can combine multiple stages (reheat, regeneration) → often 40–60 % or more |
| Emissions Control | Must treat exhaust directly (combustion by-products) | Sealed fluid avoids direct combustion emissions; only heat exchangers interact with combustion or heat source |
| Heat Source Flexibility | Predominantly combustion of fuel | Can use any external heat: solar, nuclear, geothermal, biomass |
| Complexity & Cost | Simpler plant layout; lower capital cost | More equipment (recirculation pumps/compressors, heat exchangers) → higher initial cost |
| Startup & Transients | Quick: no need to pressurize loop | Slower: loop must warm up/pressurize before production |
| Maintenance | Easier—components are exposed | Requires leak-tight seals and more complex heat‐exchanger maintenance |
C. When to Use Which
- Open-Cycle
- Peaking and backup power (fast start, modular).
- Sites where fuel combustion and exhaust treatment are acceptable.
- Closed-Cycle
- When you need high efficiency and can supply a steady external heat source (e.g. nuclear, solar thermal, waste-heat).
- Environments where emissions must be fully contained (offshore, enclosed facilities).
UNIT 5
Key Measurements & Instruments
| Measurement | Typical Sensors & Principles |
|---|---|
| Temperature | - Thermocouples (Type K, R, S): wide range, rugged<br>- RTDs (Pt100): high accuracy in moderate range<br>- Optical Pyrometers: non-contact, high-temperature (> 800 °C) |
| Flow | - Differential-pressure (Orifice, Venturi): simple, reliable<br>- Velocity (Turbine, Vortex shed): moving parts, good for clean fluids<br>- Magnetic/Ultrasonic: no moving parts, suitable for dirty or steam flow |
| Pressure | - Bourdon Tube: mechanical, up to ~100 bar<br>- Diaphragm/ Capsule: low- to medium-range, sensitive<br>- Strain-gauge Transmitters: piezo-resistive, electronic output |
| Water/Steam Conductivity | - Two-electrode Conductivity Probes: detects ionic impurities<br>- Four-electrode (Toroidal): more accurate at high purity, avoids polarization |
| Flue-Gas Analysis | - ZrO₂ (O₂) Sensors: in-situ lambda probes<br>- NDIR Analyzers (CO₂, CO): extractive sampling + non-dispersive infrared<br>- Electrochemical Cells (NOₓ, SO₂): wet or dry extractive |
Drum Level Control
- Purpose: Maintain proper water level in boiler drum to ensure safe steam generation.
- 3-Element Control Scheme
- Drum Level (ρ): measures actual water level.
- Feedwater Flow ( ): total flow into drum.
- Steam Flow ( ): flow out as steam.
- Controller Logic:
- Feed-forward: balances vs. to anticipate level changes.
- Feedback: corrects level deviations (ρ) by modulating feedwater valve.
- Benefit: Stable level under load swings, protects against dry-out or carry-over.
Combustion Control
- Objective: Maintain optimal air–fuel ratio (stoichiometry) for efficient, low-emission firing.
- Control Loops:
- Master (Firing Rate) → sets fuel flow based on load demand.
- Air-Flow Controller → adjusts FD (Forced Draft) & ID (Induced Draft) dampers/fans to match excess-air factor.
- O₂ Trim (Lambda Control) → fine-tunes air flow using real‐time flue-gas O₂ measurement.
- Strategies:
- Fixed-ratio: simple, safe for small changes.
- Adaptive/Model-based: accounts for furnace heat‐up, fuel calorific value.
Superheater & Reheater Temperature Control
- Why: Prevent metal over-temperature while ensuring steam quality.
- Methods:
- Spray Desuperheaters: inject controlled water spray into steam to ‘quench’ superheat.
- Bypass (Trombone) Tubes: divert some flue gas around the superheater to reduce heat input.
- Control Loop:
- Temperature Transmitter → PID controller → modulates spray-valve or bypass damper.
- Note: Fast dynamics; often cascade-controlled with outlet steam flow as inner loop.
Furnace Safeguard & Supervisory System (FSSS)
- Role: Protect boiler from unsafe conditions by monitoring critical parameters and initiating trips.
- Core Functions:
- Flame Monitoring: UV/IR scanners ensure continuous flame; trip on flame‐out.
- Pressure & Temperature Limits: high/low steam-pressure, temperature interlocks.
- Level Alarms: high/low water alarms separate from level control.
- Fuel-Air Fan Failure: detect loss of draft or fuel supply.
- Architecture: Redundant, hardwired logic and voting schemes (e.g. 2-out-of-3) for high reliability.
Auto Turbine Run-Up System (ATRS)
- Purpose: Automate start-up sequence of steam turbine and synchronizing to grid.
- Stages:
- Warm-up & Vacuum Evacuation (if condensing): activate gland steam, vacuum pumps.
- Hydraulic/Oil System Pressurization: ensure bearing lubrication and servo-control readiness.
- Turning Gear Drive: slowly rotate shaft to prevent bowing.
- Acceleration Ramp: control oil-hydraulic valves for smooth speed increase via speed controller.
- Control Valve Sequencing: open inlet valves in staggered steps to manage torque.
- Synchronizing Module: measures voltage, frequency, phase; closes generator breaker when in-step.
- Benefits: Reduces operator workload, ensures repeatable, safe start-up and grid connection.
UNIT 6
Economics of Power Generation
Load Duration Curve (LDC)
- Definition: A plot of power demand (MW) sorted from highest to lowest against the percentage (or hours) of time that demand is met or exceeded in a year.
- Construction Steps:
- Collect hourly load data for 8,760 hours.
- Sort loads in descending order.
- Plot: Y-axis = load (MW), X-axis = cumulative hours or percent of year.
- Interpretation:
- Base-load region: Flat left segment—power plants that run nearly continuously (e.g., nuclear, large hydro).
- Intermediate-load region: Middle slope—plants cycling daily or weekly (e.g., coal, combined-cycle gas).
- Peak-load region: Right tail—plants used only a few hours (e.g., peaking gas turbines, diesel).
- Key Metrics:
- Capacity Factor (CF):
- Utilization (Plant Use) Factor: Percent of time a plant runs above a designated output.
Power Plant Cost Components
- Fixed (Capital) Costs:
- Overnight Capital Cost: Total cost if plant built instantly: equipment, civil works, engineering, owner’s costs.
- Annualized Fixed Charge Rate (AFCR):
> where i = interest rate, n = plant life (years).
- Annual Fixed Cost = Overnight Cost × AFCR.
- Variable (Operating) Costs:
- Fuel Cost:
- O&M Cost: Routine maintenance, spares, labor (usually ₹/kWh).
- Levelized Cost of Electricity (LCOE):
- Plant Mix Optimization:
- Match base, intermediate, and peak plants to LDC segments to minimize total system LCOE while ensuring reliability.
Pollution from Power Plants
| Pollutant | Source | Environmental/Health Impact | Control Technologies |
|---|---|---|---|
| SO₂ | Sulfur in coal/oil | Acid rain; respiratory irritation | Wet limestone/gypsum FGD scrubbers; dry sorbent injection |
| NOₓ | High-T combustion gases | Photochemical smog; lung damage | Low-NOₓ burners; flue-gas recirculation; SCR (Selective Catalytic Reduction) |
| PM₂.₅/PM₁₀ | Fly ash, soot | Cardiovascular, respiratory issues | Electrostatic precipitators (ESPs); baghouse filters |
| CO₂ | Fossil fuel combustion | Global warming (greenhouse gas) | Efficiency improvements; carbon capture & storage (CCS) |
| Heavy Metals (Hg, As) | Trace in coal | Neurotoxicity (Hg); carcinogen (As) | Activated carbon injection; mercury oxidation catalysts |
- Key Strategies:
- Fuel Switching: Low-sulfur coal or natural gas.
- Process Optimization: Improve combustion to reduce NOₓ formation.
- Waste Heat Recovery: Increases overall thermal efficiency → fewer emissions per kWh.
Disposal & Management of Nuclear Waste
Waste Classification
- Low-Level Waste (LLW):
- Contaminated clothing, filters, tools.
- Half-lives: days to a few years.
- Intermediate-Level Waste (ILW):
- Reactor resins, chemical sludge.
- Requires shielding, half-lives up to decades.
- High-Level Waste (HLW):
- Spent nuclear fuel or reprocessing residues.
- Intense heat generation, half-lives up to thousands of years.
Half-life (symbol t½) is the time required for a quantity (of substance) to reduce to half of its initial value
Management Steps
- On-Site Storage:
- Spent Fuel Pools: Water-cooled pools remove decay heat, provide radiation shielding.
- Dry Cask Storage: After ~5–10 years’ cooling, transfer to inert‐gas or helium-filled steel/concrete casks.
- Reprocessing (Optional):
- Chemical separation to recover uranium and plutonium for MOX fuel, reducing waste volume.
- Final Disposal:
- Deep Geological Repository: Multi‐barrier system (engineered canisters + stable rock) for HLW.
- Near‐Surface Disposal: Engineered vaults for LLW/ILW.
Energy Conservation & Auditing
Concept of Energy Conservation
- Definition: Systematic reduction of energy consumption through efficiency improvements and waste minimization.
- Approaches:
- Technological: LED lighting, high-efficiency motors, variable-speed drives, heat recovery.
- Behavioral: Shutdown idle equipment, optimize thermostat settings, staff training.
- Process: Insulation, leak detection in compressed air systems, CHP (cogeneration).
Energy Auditing
- Purpose: Identify where energy is used, wasted, and how to reduce consumption.
- Audit Levels:
- Walk-Through Audit:
- Quick survey: examine major equipment, spot obvious waste (e.g., steam leaks).
- Little or no instrumentation.
- Detailed Audit:
- Instrument measurements: metering of electricity, fuel, flow rates, temperatures.
- Analyze process data; quantify savings for each measure.
- Investment-Grade Audit:
- Comprehensive data logging over weeks/months.
- Detailed financial analysis: payback period, net present value (NPV), internal rate of return (IRR).
- Walk-Through Audit:
- Typical Audit Steps:
- Pre-Audit Data Collection: Utility bills, equipment lists, operating schedules.
- Site Inspection: Identify potential efficiency measures (PFCs): lighting, HVAC, motors, boilers.
- Measurement & Monitoring: Use portable meters, thermography cameras, data loggers.
- Analysis & Reporting:
- Baseline: Current energy consumption.
- Recommendations: Technical description, energy savings (kWh, GJ), cost estimate, payback.
- Implementation & Verification: Post-implementation measurement to confirm savings.
NUMERICALS
Calculate efficiency, work output, or heat rates for given steam cycle parameters (numerical problem).
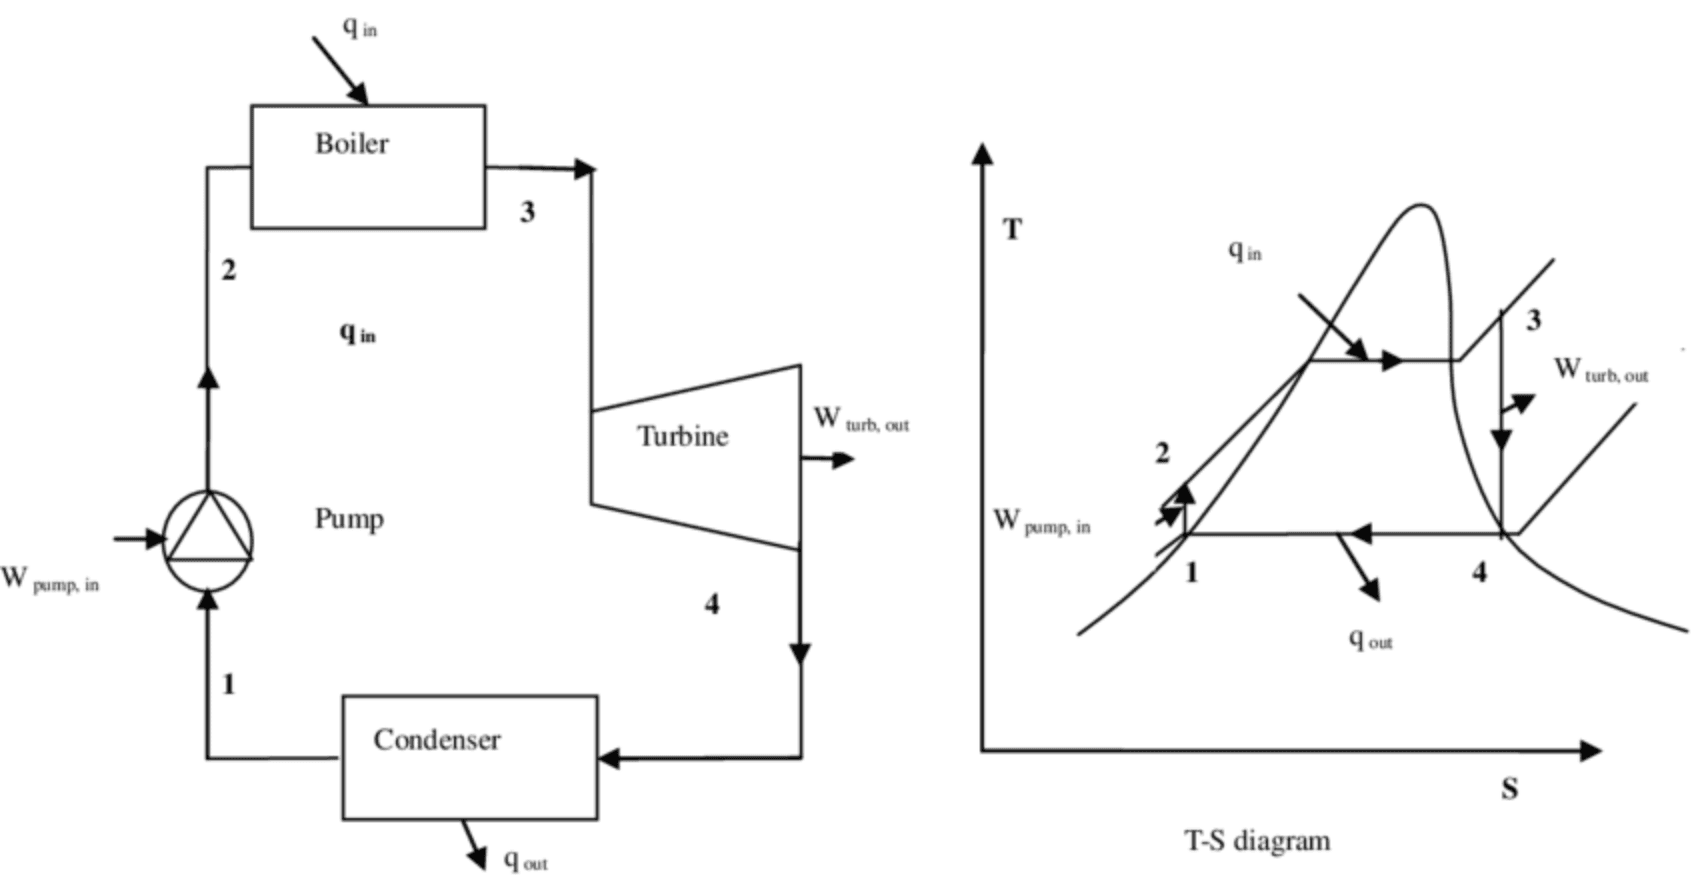
Basic Theory
- Isentropic Expansion:
- When steam expands in the turbine, the process is often assumed to be isentropic (i.e., the entropy remains constant).
- This helps us find the quality of steam (the ratio of vapor to total mass) at the turbine exit using the steam table values.
Key Formulas and Their Meanings
Turbine Work Output:
- Formula:
- Explanation: is the enthalpy of steam at the turbine inlet, and is the enthalpy at the turbine exit. Their difference represents the energy converted to work.
Heat Input:
- Formula:
- Explanation: is the steam enthalpy coming out of the boiler, and is the enthalpy of water entering the boiler. This difference is the energy added to the cycle.
Thermal Efficiency:
- Formula:
- Explanation: The efficiency is the ratio of the net work output (usually taken as the turbine work when pump work is negligible) to the heat input.
Heat Rate:
- Formula:
- Explanation: This shows how much heat energy is required to produce one unit of electrical energy. The multiplication by 3600 converts the units from kJ per kJ to kJ per kWh.
Determining Steam Quality (for Isentropic Expansion):
- Formula:
- Explanation: Here, is the entropy at the turbine inlet, and are the entropies of the saturated liquid and vapor at the turbine exit pressure, and is the steam quality (fraction of vapor). Once is known, you can find using:
Sample Problem
A simple Rankine cycle operates under the following conditions:
- Boiler (State 1): Steam is generated at 10 MPa and 600°C.
- Turbine Exit (State 2): Steam expands isentropically to 0.1 MPa.
- Assumption: Pump work is negligible.
Using approximate steam table data:
- At 10 MPa and 600°C:
- At 0.1 MPa (saturated conditions):
- Saturated liquid enthalpy,
- Saturated vapor enthalpy,
- Saturated liquid entropy,
- Saturated vapor entropy,
Tasks:
- Determine the turbine exit enthalpy .
- Calculate the net work output per kg of steam.
- Compute the thermal efficiency of the cycle.
- Determine the heat rate (in kJ/kWh).
Step-by-Step Solution
1. Turbine Expansion (State 1 to State 2)
Since the expansion is isentropic:
At 0.1 MPa, let the quality of the steam be . Then:
Solving for :
x = \frac{s_1 - s_f}{s_g - s_f} = \frac{6.50 - 1.10}{7.50 - 1.10} = \frac{5.40}{6.40} \approx 0.844Now, determine the enthalpy at turbine exit :
Substitute the values:
h_2 = 417 + 0.844 \times 2167 \approx 417 + 1828 \approx 2245\ \text{kJ/kg}2. Turbine Work Output
Turbine work per kg of steam is given by:
W_{\text{turbine}} = h_1 - h_2 = 3580 - 2245 \approx 1335\ \text{kJ/kg}3. Heat Input and Thermal Efficiency
Assuming the feedwater enters the boiler at nearly the condensate condition , the heat input is:
Q_{\text{in}} = h_1 - h_{\text{feedwater}} = 3580 - 417 = 3163\ \text{kJ/kg}Thermal efficiency is:
\eta = \frac{W_{\text{net}}}{Q_{\text{in}}} \approx \frac{1335}{3163} \approx 0.422\ \text{or}\ 42.2\%4. Heat Rate
Heat rate is the amount of heat input required per unit of work output. In kJ per kWh, it is calculated as:
Result
- Turbine Exit Enthalpy : ~2245 kJ/kg
- Net Work Output: ~1335 kJ/kg
- Thermal Efficiency: ~42.2%
- Heat Rate: ~8532 kJ/kWh